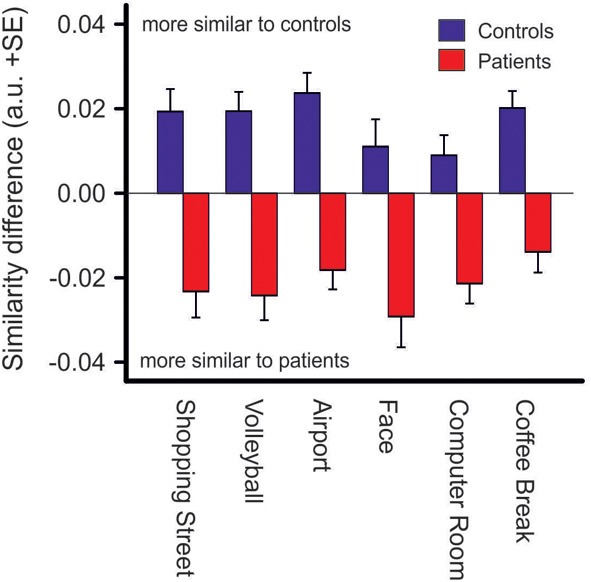
Figure 6.

Similarity difference scores resulting from comparisons of scanpath sequences between patients and controls. Positive values indicate a stronger scanpath similarity to the control group whereas negative values indicate a stronger scanpath similarity to the patient group (see Materials and Methods), p < 0.001 for group differences in each photo.
