Figure 3.
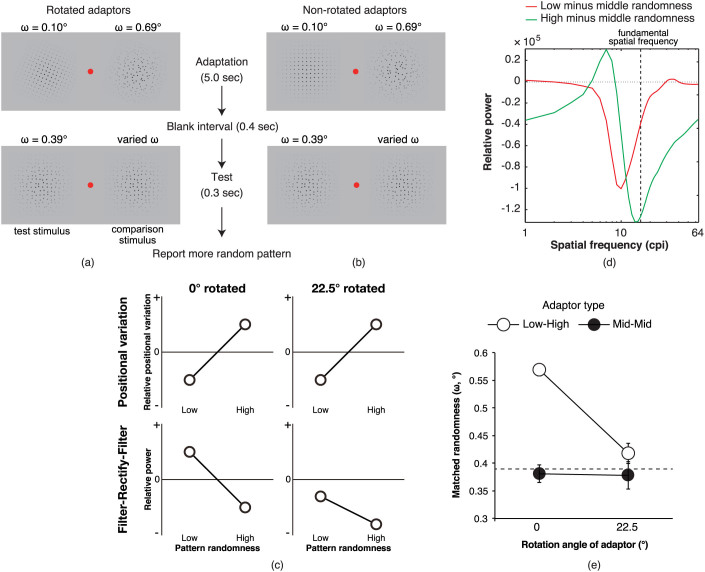
(a, b) Schematic diagrams for stimulus presentation in (a) rotated adaptor and (b) non-rotated adaptor conditions. (c) Models. The top two and bottom two panels show the possible outputs from the positional variation model and the filter-rectify-filter (FRF) model, respectively. The left two and right two panels show the possible outputs when the adaptor pattern is rotated by 0° and 22.5°, respectively. The zero on the vertical axis means a possible output value for the middle randomness pattern. A relative positional variation does not change even when the pattern is rotated (top right). Conversely, the relative power of outputs from an FRF process with vertical second-order filters decreases to negative values regardless of the adaptor's randomness when the pattern is rotated (bottom right). Thus, when the adaptor pattern is rotated, the positional variation model predicts an intact pattern randomness aftereffect but the FRF model predicts no aftereffect. (d) The differences in the second-order filter responses between the rotated low-randomness patterns and the non-rotated middle-randomness patterns (red curve) and between the rotated high-randomness patterns and non-rotated middle-randomness patterns (green curve). When the adaptors were rotated by 22.5°, the sign of the difference in the power between the patterns was negative for both pairs of adaptor-test stimuli. (e) The results of Experiment 2. Larger y values represent a larger matched randomness of the test stimulus. The dashed line represents the physical randomness value of the test stimulus (i.e., with middle physical randomness) that was fixed through experiments. The error bars denote the standard errors of the mean (n = 4).

