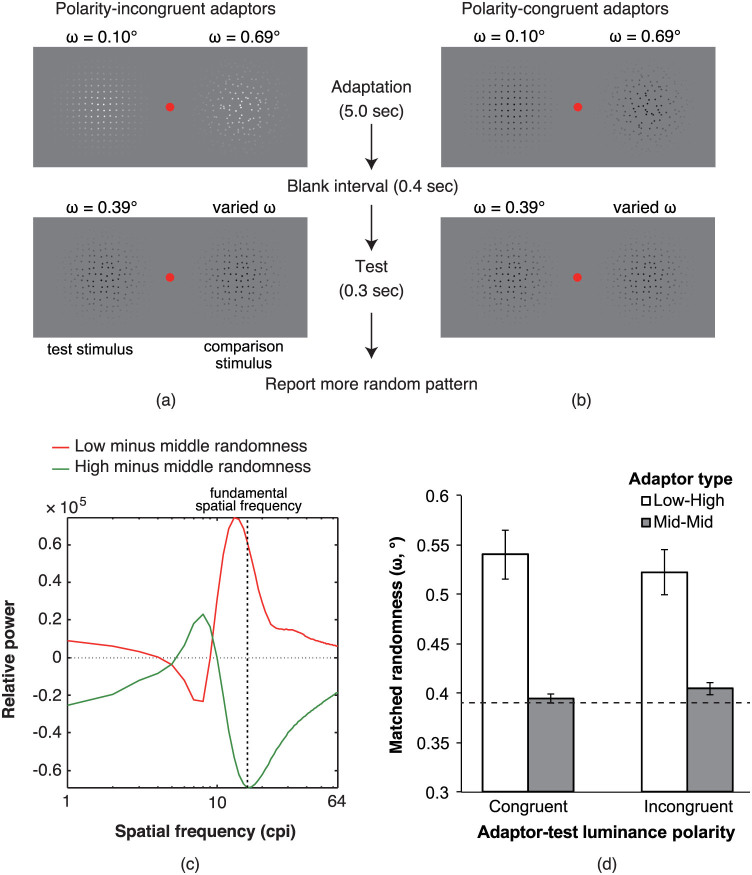
Figure 4.
(a, b) Schematic diagrams for the stimulus presentation in (a) the polarity incongruent adaptor conditions and (b) the polarity congruent adaptor conditions. (c) The output of the filter analysis. The patterns with white and black dots were convolved with on- and off-centre filters, respectively. Regardless of the contrast polarity difference between the adaptor and test stimuli, the sign of the difference in the power of the filter responses between the low- and middle-randomness patterns was opposite to the one between the high- and middle-randomness patterns. (d) The results of Experiment 3. Larger y values represent a larger matched randomness of the test stimulus. The dashed line represents the physical randomness value of the test stimulus (i.e., with middle physical randomness) that was fixed through experiments. The error bars denote the standard errors of the mean (n = 5).

