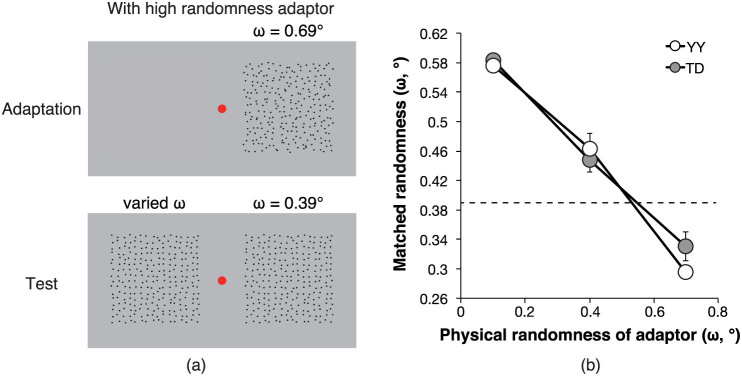
Figure 6.

(a) The single adaptor method. (b) Individual data in Experiment 5. The dashed line represents the physical randomness value of the test stimulus (i.e., with middle physical randomness) that was fixed through experiments. The error bars denote 95% confidence intervals calculated on the basis of the psi method.
