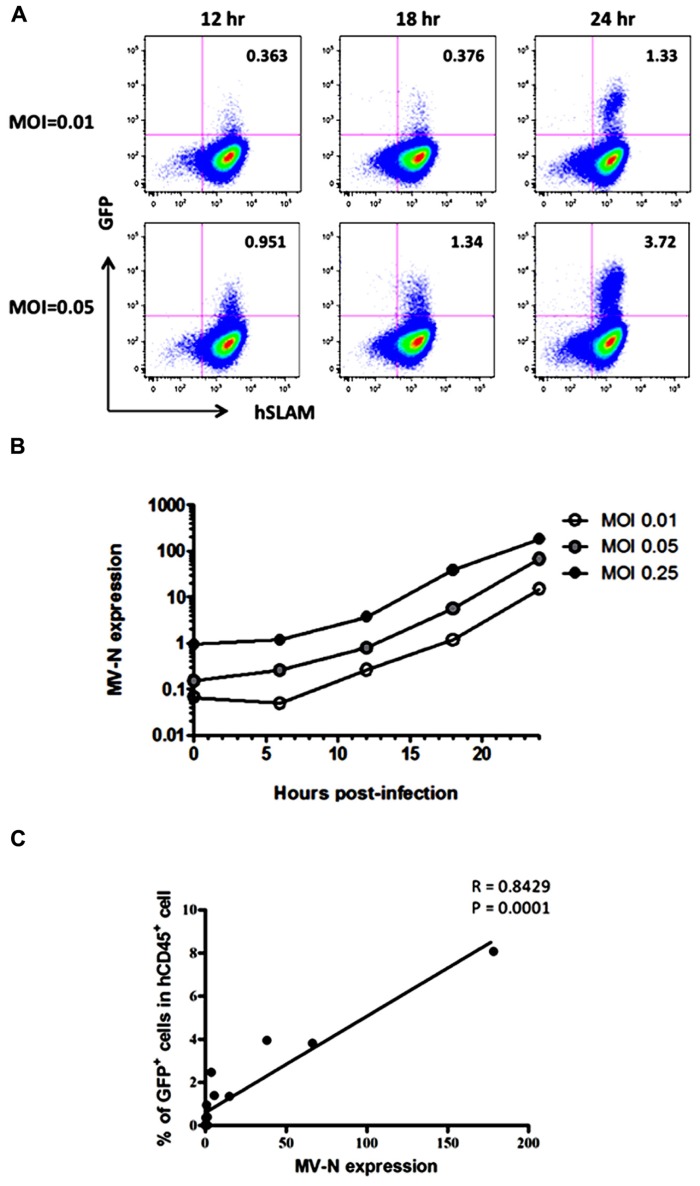
FIGURE 2.
course of MV infection in vitro. Jurkat/hSLAM cells were infected with wild-type MV IC323-EGFP at MOI of 0.01, 0.05, and 0.25, washed, and harvested at the indicated time points. (A) Cells were stained with PE-conjugated anti-hSLAM mAb, fixed with 2% formalin/PBS, and GFP expression was analyzed. (B) RNA was extracted from cells, and expression levels of MV-N and RNase P were analyzed by one-step qRT-PCR. The copy numbers of MV-N and RNase P were determined, and the ratio of MV-N copies to RNase P copies is depicted on the vertical axis. (C) Correlation between the percentage of GFP+ Jurkat/SLAM cells and the time course of MV-N expression. Spearman’s rank correlation coefficient was used for statistical analysis.

