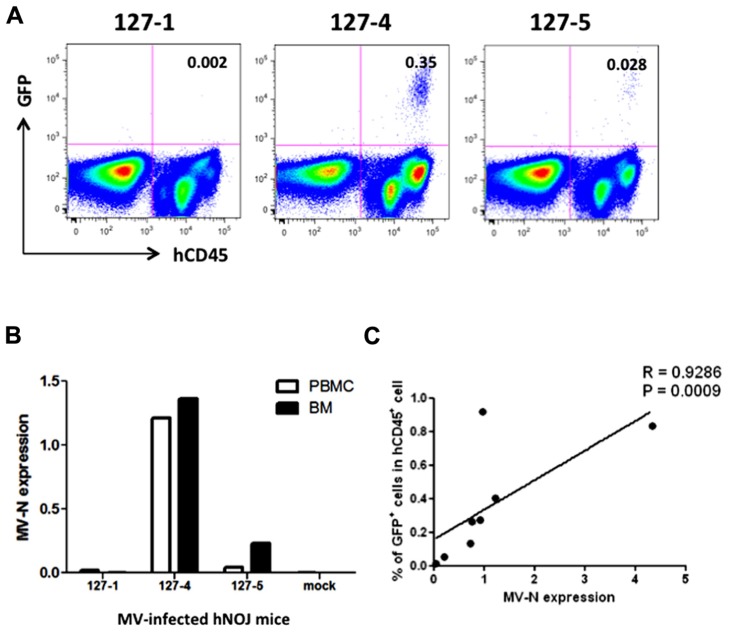
FIGURE 3.
Analysis of MV infection in vivo. Three hNOJ mice (127-1, -4, and -5) were infected intravenously with 2,000 pfu of the MV vaccine strain, AIK-C-EGFP. Mice were sacrificed at day 7 post-infection, and blood and bone marrow cells (BM) were obtained. (A) BM cells were stained with PB-anti-human CD45 mAb, fixed with 2% formalin/PBS, and GFP expression was analyzed. (B) PBMCs from blood and BM cells were lysed, and RNA was prepared. The expression MV-N and RNase P was analyzed as described in the legend for Figure 2B. (C) Correlation between the percentage of GFP+ cells among hCD45+ cells in BM and the level of MV-N expression in MV-infected hNOJ mice, at day 7 (n = 4) or day 10 (n = 4) p.i. Spearman’s rank correlation coefficient was used for statistical analysis.

