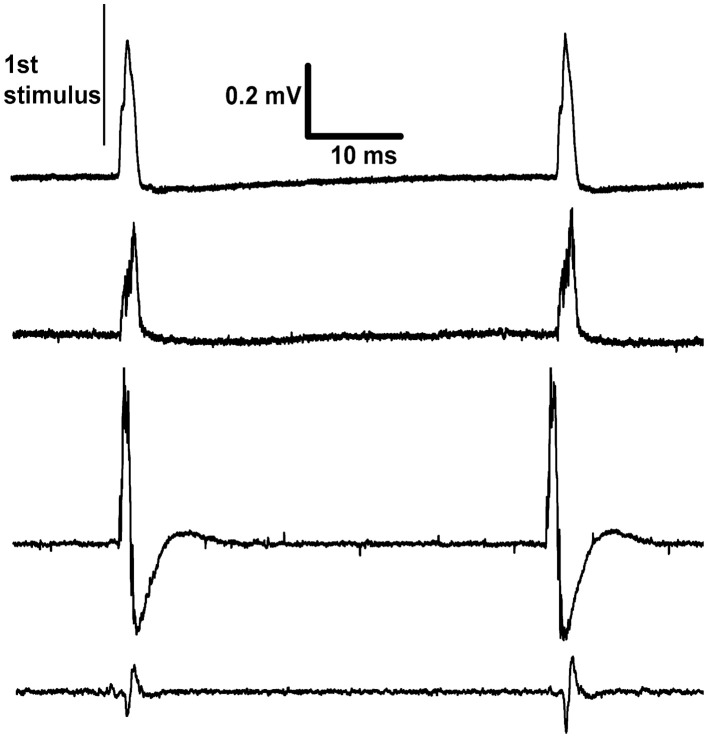
Figure 3.
Recordings made differentially from dorsal rootlets of lumbar segment L4. The proximal end of the cut sciatic nerve was stimulated at approximately 20 Hz. Each trace is from a different rat recorded on the last day of continuous stimulation and shows two responses per trace. The differences between traces in the sizes and shapes of evoked response are explained by their dependence on factors such as the positioning of the paired recording electrodes and inter-electrode conductance.

