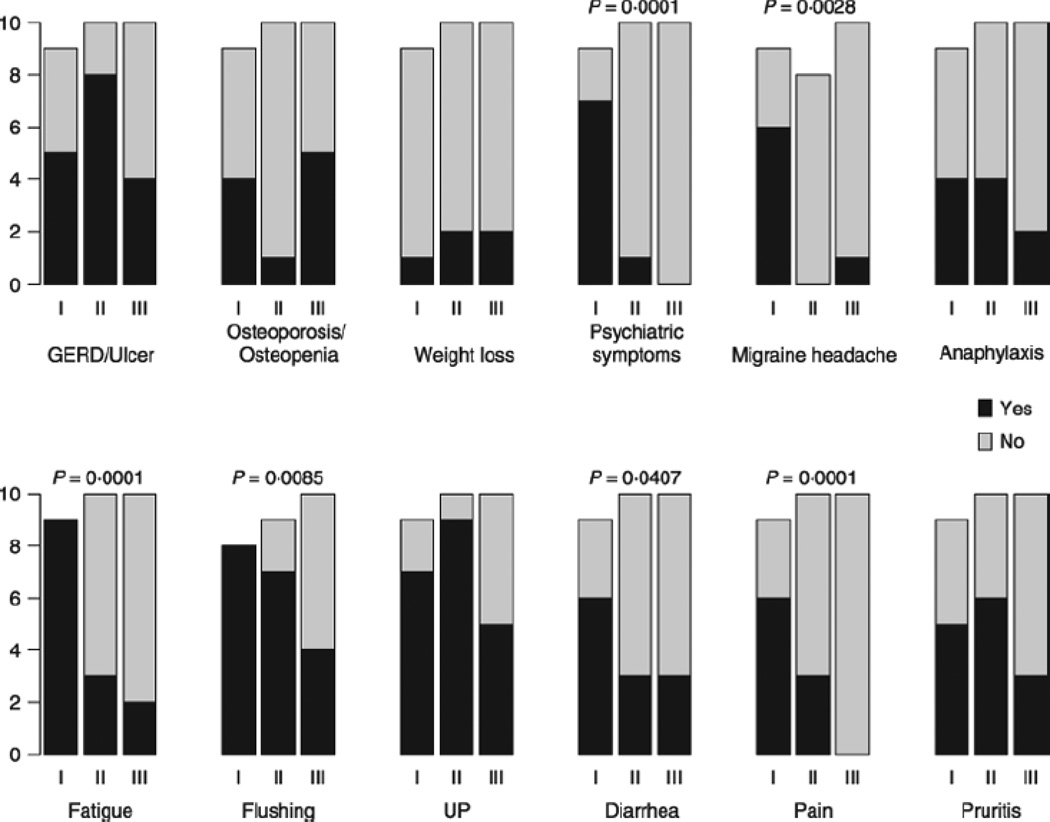
Figure 3.
Distribution and analysis of symptoms within groups. Groups with low (I), normal (II) and high (III) levels of serotonin were compared based on their clinical symptoms. Bars represent the number of patients where the grey portion is assigned to patients without symptoms, and the black portion is assigned to patients with symptoms. The association between continuous serotonin values and presence of symptoms is evaluated with Spearman rank correlation, P-values of statistically significant associations (P < 0·05) are shown above bars.

