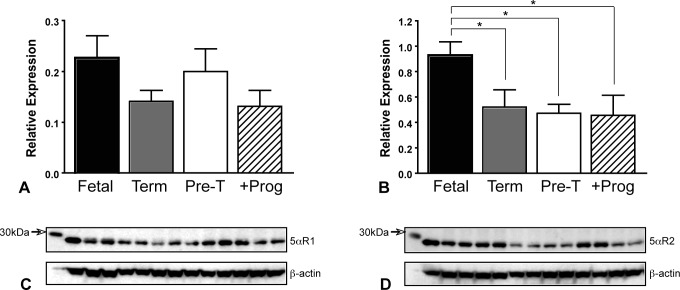
Figure 3.
Expression of 5α-reductase enzymes in fetal (n = 16), term (n = 11), preterm (n = 12; pre-T), and preterm progesterone-treated neonatal guinea pig (n = 8; +Prog) brains. A, Relative expression and (C) representative Western blots (with β-actin loading control) of 5α-reductase type 1. B, Relative expression and (D) representative Western blots (with β-actin loading control) of 5α-reductase type 2. Bars represent mean ± SEM. *, significant differences between groups (P < .05). SEM indicates standard error of the mean.

