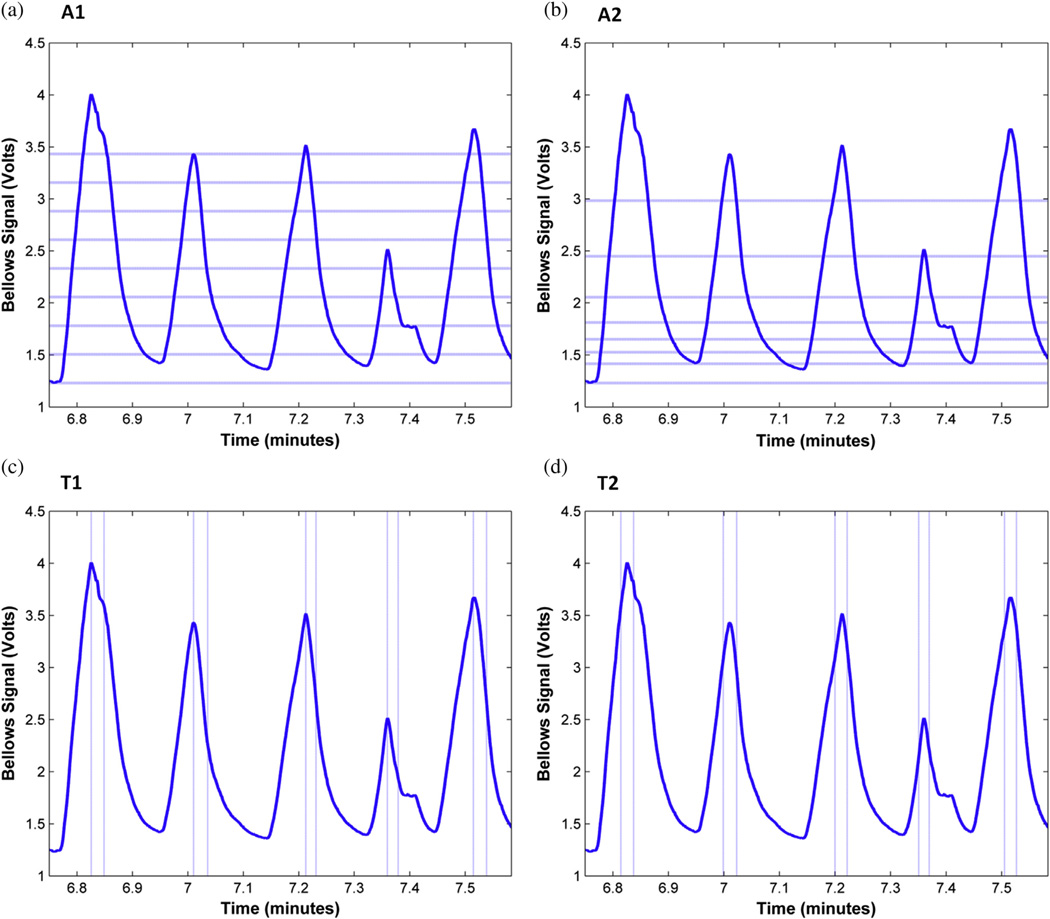
Fig. 2.
Illustration of gating algorithms on a part of patient 2’s breathing trace during positron emission tomography acquisition: algorithm A1, amplitude-based with equal amplitude windows; A2, amplitude-based with equal events per window; T1, temporal phase-based with the first gating window starting at peak inhale; T2, temporal phase-based with the first gating window centered on peak inhale. Dotted lines show the boundaries between gating windows. For clarity, only the first gating window is shown for methods T1 and T2.

