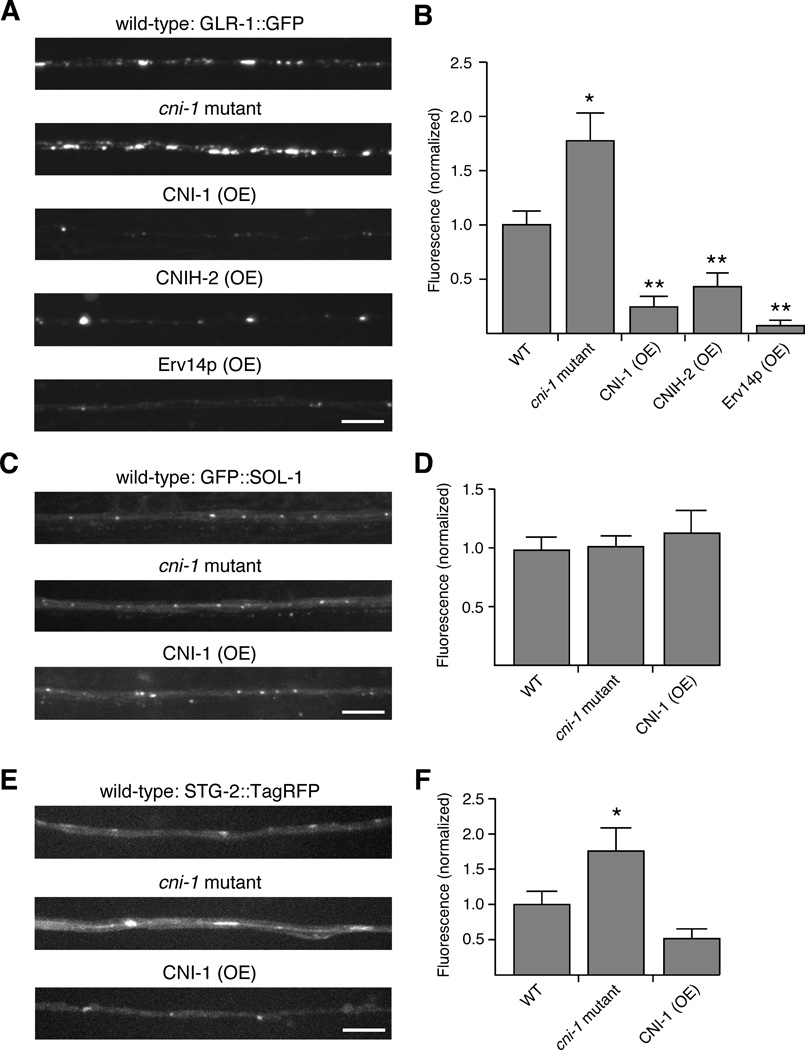
Figure 2.
Synaptic levels of GLR-1::GFP are increased in cni-1 mutants and decreased by overexpression of cornichon proteins. (A and B) Confocal images of GLR-1::GFP (A) and the total GFP fluorescence (B) in the AVA processes of wild-type worms (n=11), cni-1 mutants (n=11) and transgenic mutants that overexpressed CNI-1 (n=10), CNIH-2 (n=9) or Erv14p (n=7). (C and E) Confocal images of either GFP::SOL-1 (C) or STG-2::TagRFP (E) in the AVA neurons of transgenic worms. (D and F) GFP (D) or TagRFP (F) fluorescence in transgenic wild-type worms (GFP, n=12; TagRFP, n=15), cni-1 mutants (GFP, n=11; TagRFP, n=10) and transgenic mutants that overexpressed CNI-1 (GFP, n=5; TagRFP, n=8).
Significantly different from wild type (* p<0.05 and ** p<0.01). Scale bars represent 5 µm. Error bars represent SEM.
See also Figure S4.

