Figure 3.
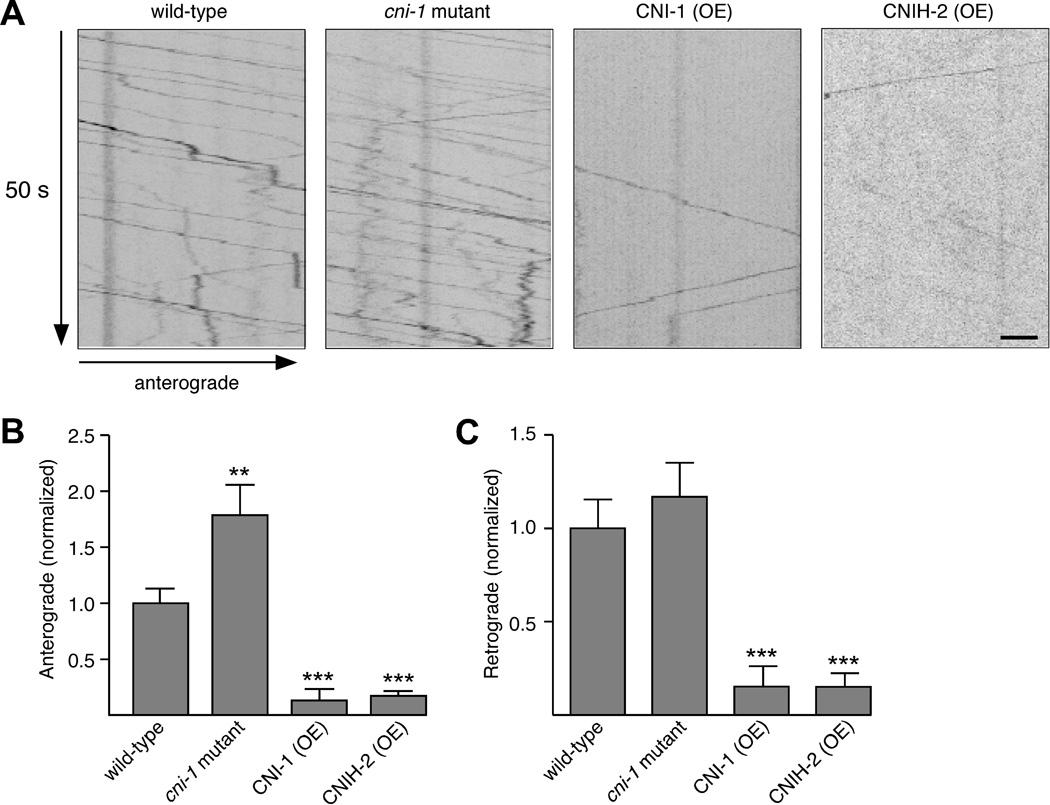
The frequency of GLR-1 anterograde transport is increased in cni-1 mutants. (A) Kymographs showing the movement of GLR-1::GFP in the AVA interneurons. Scale bar represents 2 µm. (B and C) Quantification of the number of anterograde (B) and retrograde (C) transport events in wild-type worms (n=13), cni-1 mutants (n=9), and cni-1 transgenic mutants that overexpressed either CNI-1 (n=10) or CNIH-2 (n=10). Significantly different from wild type (** p<0.01 and *** p<0.001). Error bars represent SEM.

