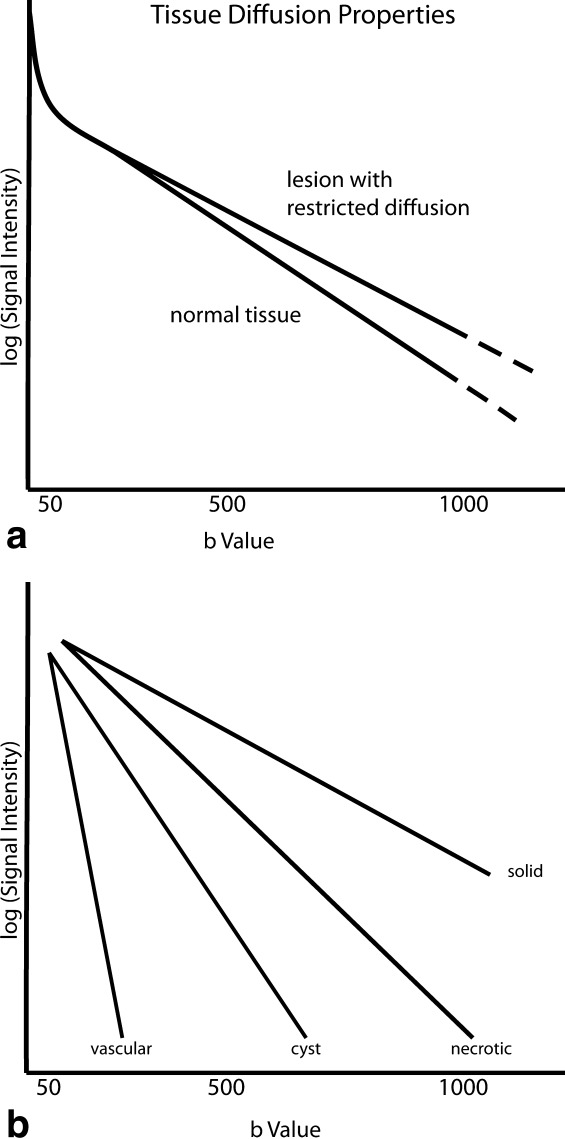
Figure 6.

Tissue diffusion curve behavior for native tissue, and a restricted lesion within the tissue (a). The restricted lesion has a less steep slope and thus low ADC value. In body imaging typically the greatest separation in signal intensity between native and restricted tissue with background tissue visibility occurs near b-value of 500 s/mm2 (b). Outlines the difference in slope/ADC from near horizontal for solid tissue to the steepest for vascular lesions. The slope differences represent the premise for assessing ADC change of a solid restricted mass initially becoming edematous with treatment with resultant rising ADC values.
