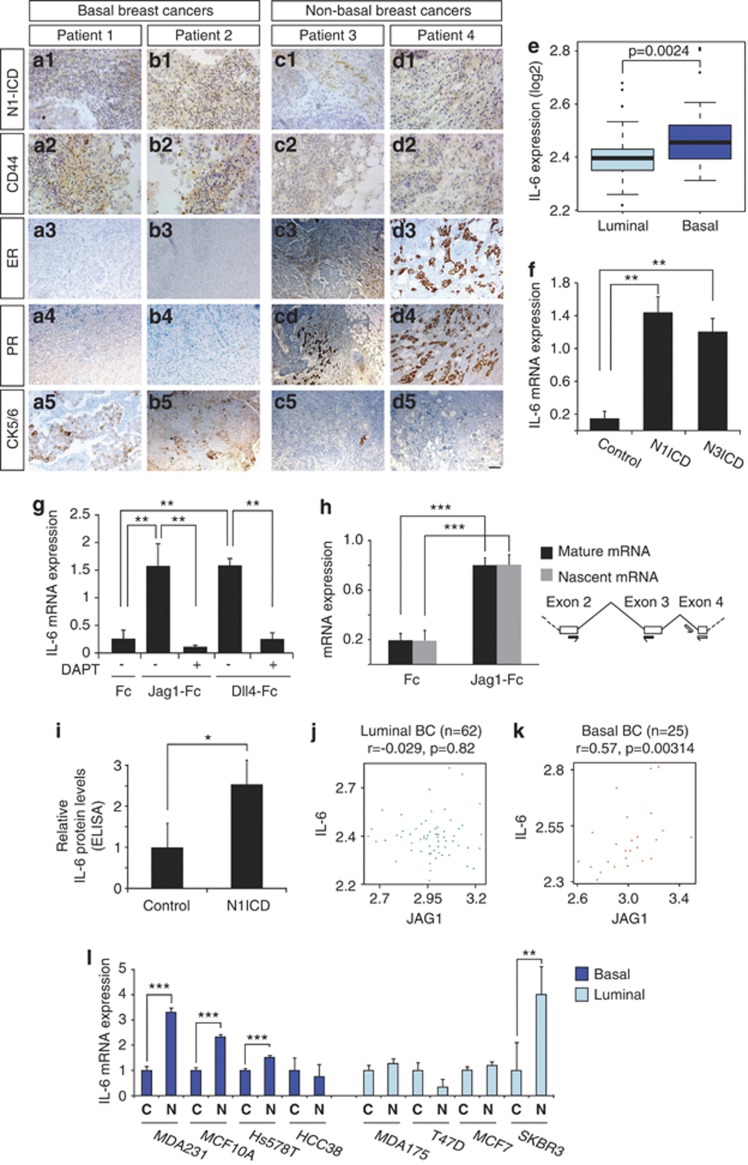
Figure 1.
Notch signaling controls IL-6 expression. (a-d) Expression of Notch1 ICD in two basal (a, b) and two non-basal (c, d) breast cancers (data from 12 additional patients are shown in Supplementary Figure 1). Notch1 ICD expression (a1–d1) was analyzed by immunohistochemistry for the N-terminus of Notch1 ICD generated following γ-secretase cleavage. Expression of CD44 (a2–d2), estrogen receptor-α (ER; a3–d3), progesterone receptor (PR; a4–d4) and cytokeratin 5/6 (CK5/6; a5–d5) was analyzed using previously described antibodies. (e) Expression levels of IL-6 in luminal and basal breast tumors16 (f, g) IL-6 mRNA expression measured by quantitative PCR (QPCR) in MDA-MB-231 cells (f) infected with adenoviral vectors expressing GFP, Notch1 ICD (N1ICD) or Notch3 ICD (N3ICD) or (g) cultured on immobilized Jagged1 or Dll4 ligands (Jag1-Fc and Dll4-Fc, respectively) or Fc fragments as control (Fc). In some of the experiments in g, the γ-secretase inhibitor DAPT was used to block Notch receptor proteolytic processing. (h) Analysis of effects of Notch activation on production of nascent versus mature IL-6 mRNA. Primer pairs were designed to capture nascent (pre-splicing) and mature (spliced) IL-6 mRNA (right), and the amount of nascent and mature IL-6 mRNA was analyzed by Q-PCR after culture on Fc-Jag1 or Fc (left). (i) Protein analysis by enzyme-linked immunosorbent assay (ELISA) from MDA-MB-231 cells transfected with Notch1 ICD or enhanced green fluorescent protein (EGFP) (control). (j, k) Correlation between IL-6 and Jagged1 mRNA data from luminal (j) and basal (k) breast cancer transcriptome data.16 (l) Expression of IL-6 mRNA in response to Notch (Notch1 ICD) activation in four basal and four luminal breast cancer cell lines. Values are significant at ***P<0.001, **P<0.01 and *P<0.05. r, correlation coefficient. Graphs represent average of three independent experiments.

