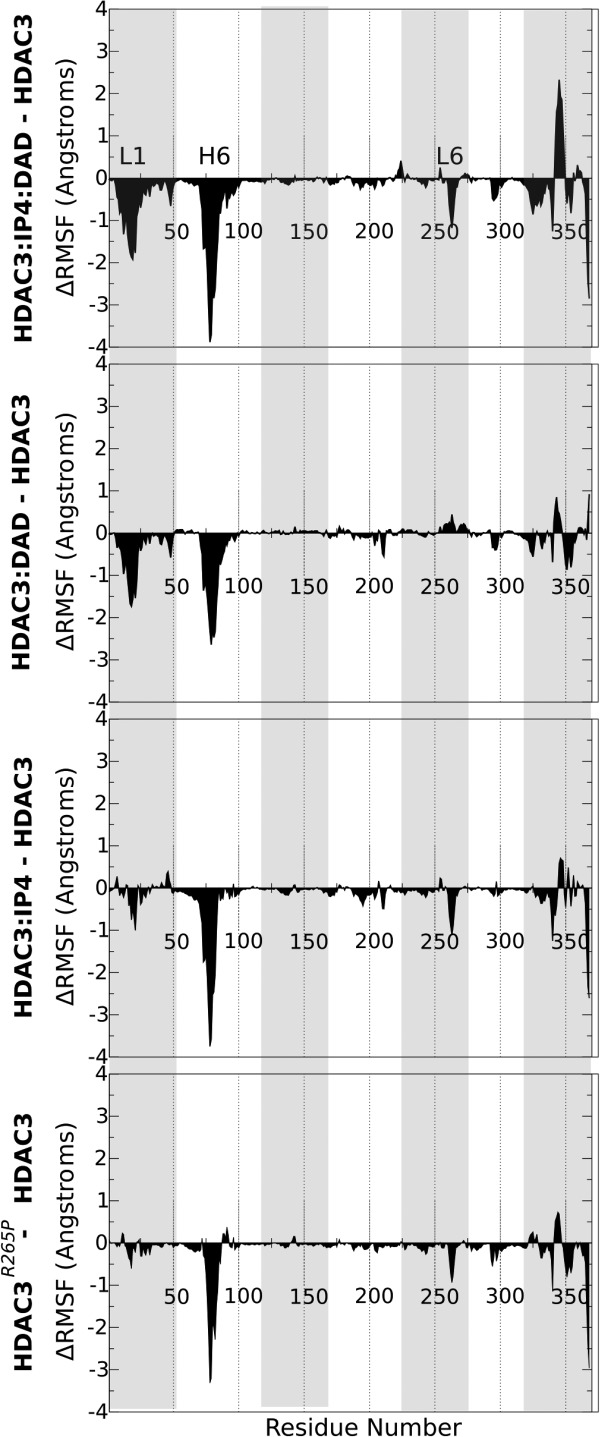
Figure 3.

 Analysis of mutant and complexed HDAC3. Differences between per-residue RMSF values (Å) are shown for (from top to bottom) HDAC3:IP4:DAD, HDAC3:DAD, HDAC3:IP4,12 and HDAC3R265P, with reference to the apo HDAC3WT RMSF values. Negative
 values correspond to stabilized regions.
