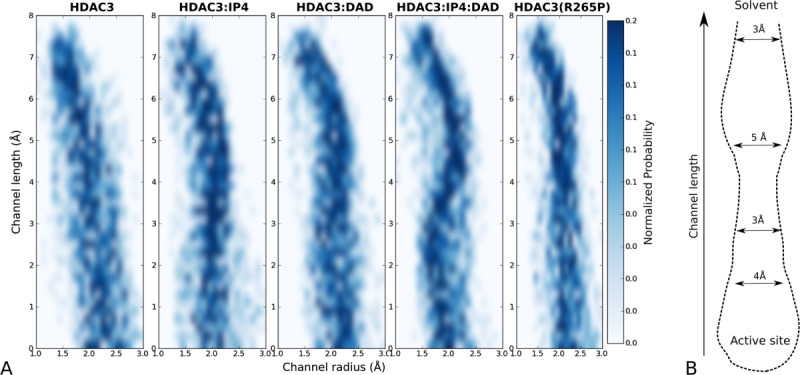
Figure 4.

Geometry of active site channel. (A) Two-dimensional histograms showing the distribution of radii along the channel length for the apo, IP4-bound, DAD-bound, and ternary WT12 simulations, as well as for the apo R265P mutant. (B) The stable channel leading to the active site, from simulations of the HDAC3:IP4:DAD complex is shown schematically, with average diameters indicated along the channel length.
