Figure 4.

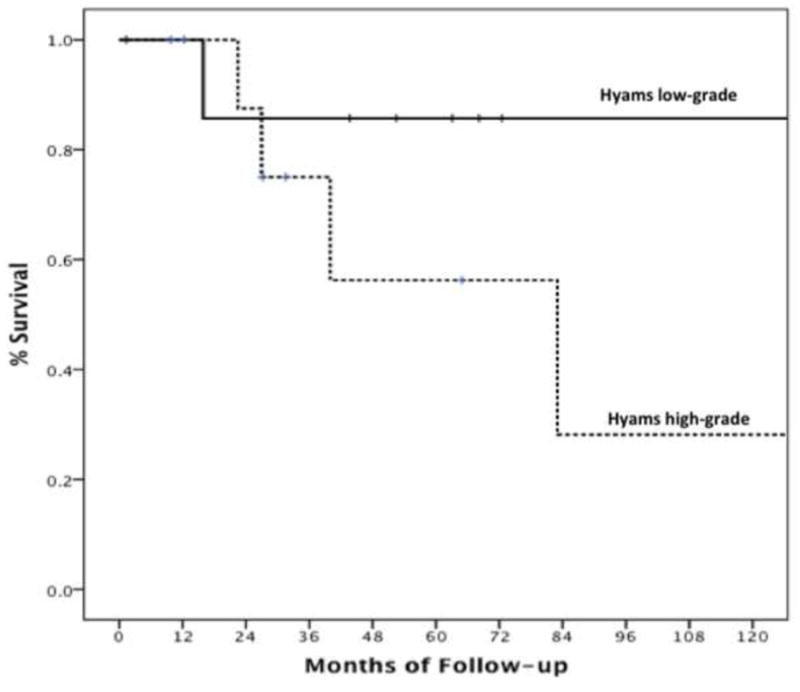
Kaplan–Meier curves demonstrating differences in overall survival between patients with low-grade and high-grade esthesioneuroblastoma (p=0.24).

Kaplan–Meier curves demonstrating differences in overall survival between patients with low-grade and high-grade esthesioneuroblastoma (p=0.24).