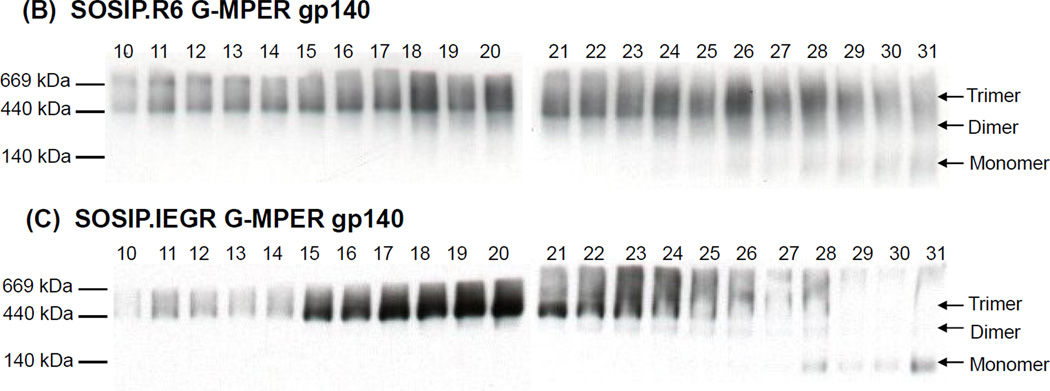
Fig. 2.
Gel filtration analysis of cleaved and uncleaved gp140s. (A) The SOSIP.R6 G-MPER (cleaved) and SOSIP.IEGR G-MPER (uncleaved) gp140s were purified by lectin-affinity chromatography and then analyzed by size-exclusion chromatography. The separation profile of the two preparations over time (minutes) is shown. The solid arrow indicates the high-molecular aggregate peak, whereas the three dotted arrows show the trimer, dimer and monomer peaks. The precise timings (in minutes) of the three gp140 protomer peaks are listed. (B, C) The gel-filtration chromatography fractions (numbered above the lanes) were analyzed using BN-PAGE and western blotting. The migration positions of relevant molecular weight standards are marked on the left.


