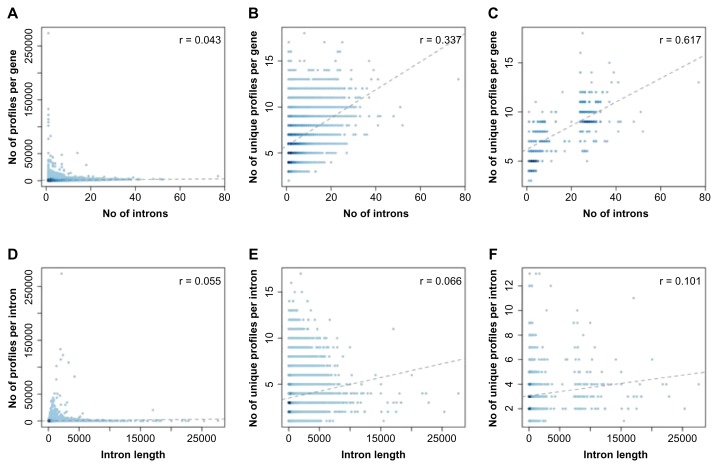
Figure 4.
The (unique) number of profiles per gene according to number of introns (upper panel) and the (unique) number of profiles per intron according to introns length (lower panel). (A), (B), (D), and (E) The results for all genes considered. (C) and (F) The results for the top 100 genes containing the largest number of introns and the top 100 genes containing the longest introns, respectively.

