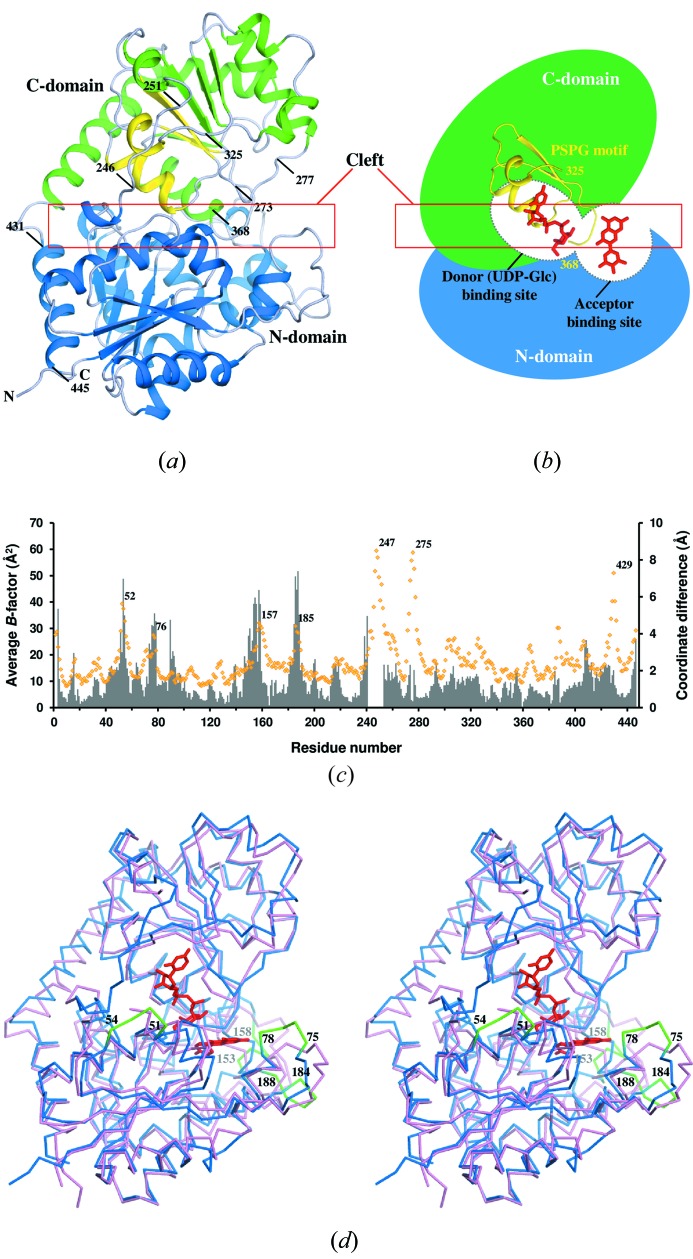
Figure 2.
(a) Overall structure of recombinant wild-type Ct3GT-A. The secondary structures within N-domain and C-domain are colored blue and green, respectively. The PSPG motif from residues 325–368 are colored yellow. The residue numbers indicate the locations of the flexible loop regions and the C-terminal helix associated with the N-domain. (b) Schematic representation of the structure of Ct3GT-A including the locations of the cleft and the donor- and acceptor-binding sites. The binding site for the donor (UDP-Glc) is formed mainly by the residues from the PSPG motif colored yellow. (c) Plots of the B-factors for each residue in Ct3GT-A and the coordinate differences between Ct3GT-A and VvGT1. Average B-factor values for the main-chain atoms of Ct3GT-A are plotted as orange rhombuses (scale on left-hand axis), with residue numbers denoted on top of the peaks. Coordinate differences between corresponding Cα atoms in the superimposed structures of Ct3GT-A and VvGT1 are presented as a bar graph (colored in grey; scale on right-hand axis). Plots corresponding to residues 241–252 in Ct3GT-A are missing because of the lack of coordinates in VvGT1. (d) Superposition of the structures of Ct3GT-A (blue) and VvGT1 (pink; PDB ID: 2c1z). The donor analog UDP-2FGlc and the sugar acceptor kaempferol in the VvGT1 structure are shown as stick models (red). Four loop regions showing significant structural differences are colored green.

