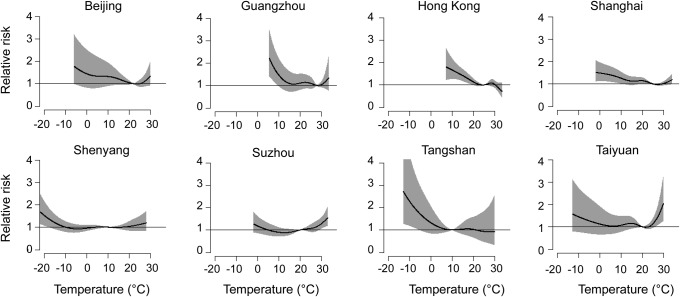
Figure 2. Nonlinear relationships between outdoor temperature and daily stroke mortality in 8 Chinese cities.
The associations were presented as relative risks of the full range of temperature with lags of 0–14 days compared to the minimum-mortality temperature. The black lines are the central effect estimates and the gray areas are the 95% intervals.

