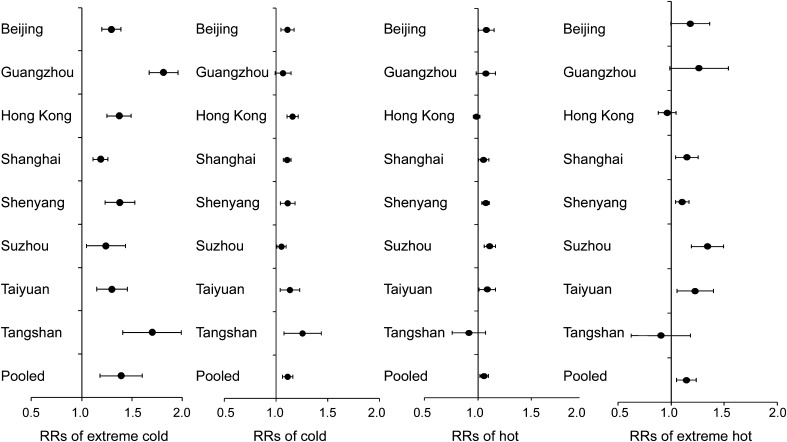
Figure 3. City-specific relative risks of stroke mortality for extreme cold, cold, hot, and extreme hot temperatures.
The dots are for the central effect estimates and the horizontal lines represent the 95% intervals. Extreme cold was defined as first percentile of temperature and cold as 10th percentile, both compared with the 25th percentile of temperature over lag 0–14 days. Extreme hot was defined as 99th percentile of temperature and hot as 90th percentile, both compared with the 75th percentile of temperature over lag 0–3 days. RR = relative risk.

