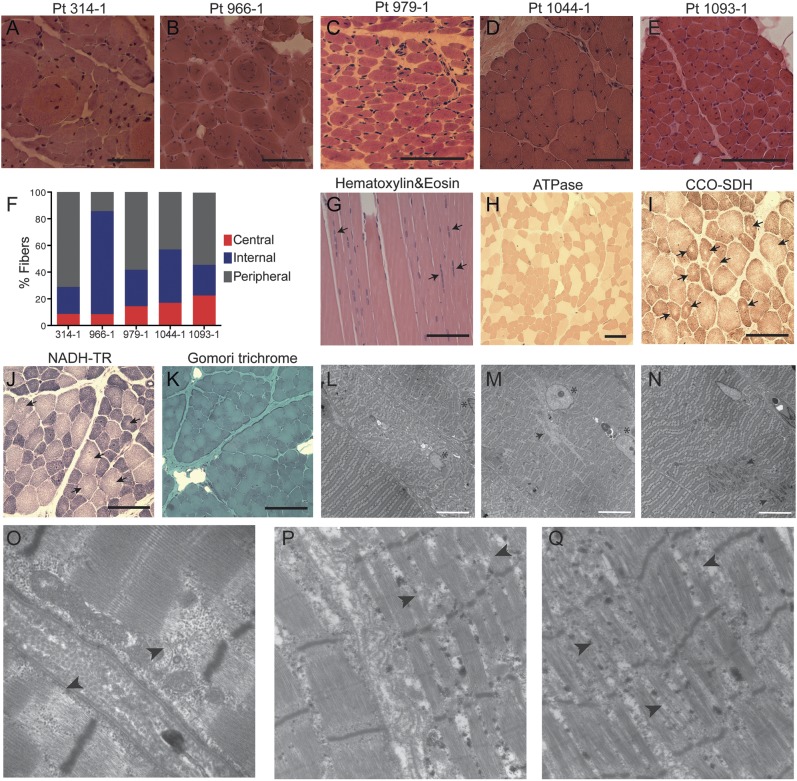
Figure 1. Skeletal muscle histopathology in patients with centronuclear myopathy carrying TTN mutations.
(A–E) Hematoxylin & eosin (H&E) staining of transverse muscle sections from patients 314-1, 966-1, 979-1, 1044-1, and 1093-1 show multiple cells with internal and central nuclei. (F) Percentages of fibers with central nuclei (i.e., nuclei in the geometric center of the fiber), internal nuclei (i.e., nuclei anywhere in the cytoplasm but the geometric center), and peripheral nuclei (i.e., nuclei underneath the sarcolemma, at the cell periphery) were calculated based on a count of at least 200 fibers. (G–K) Histochemical staining of muscle from patient 1044-1. (G) H&E staining on longitudinal section shows several fibers with multiple internal nuclei arranged in a row (arrows). (H) Adenosine triphosphatase (ATPase) staining at pH 4.3 demonstrates predominance and hypotrophy of darkly stained type I fibers. (I) Cytochrome c oxidase–succinate dehydrogenase (CCO-SDH) and (J) nicotinamide adenine dinucleotide–tetrazolium reductase (NADH-TR) stains show several fibers with central core-like areas devoid of oxidative reaction (arrows). (K) No inclusions or depositions were detected in Gomori trichrome staining. (L–Q) Electron micrograph of muscle from patient 1044-1 (L–O) and from patient 314-1 (P, Q). (L) Fibers with central nuclei (asterisk) demonstrate varying degrees of myofibrillar disorganization, compared with the normal sarcomeres that lie in parallel in a fiber with peripheral nuclei (bottom left corner). (M) Two internal nuclei (asterisk) arranged in a row in a fiber with severe sarcomeric disorganization, and regions devoid of mitochondria (arrow). (N) Z-disk streaming (arrows). (O–Q) Focus on regions with disintegrated sarcomeres showing disrupted I- and A-band regions (arrowheads). Black scale bars = 40 μm; white scale bars = 10 μm. Pt = patient.

