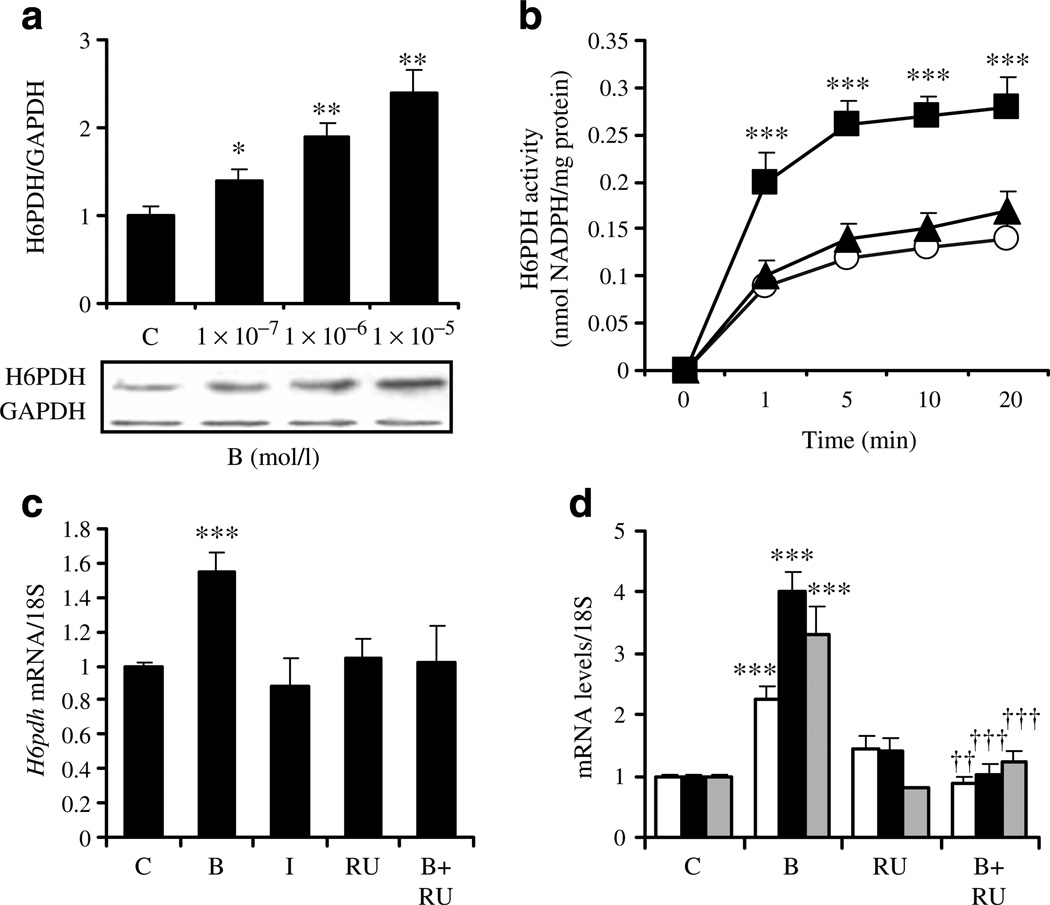
Fig. 4.
Effects of corticosterone and insulin on primary cultures of db/db mouse hepatocytes. Levels of H6PDH production (a) and activity (b) in cells treated with corticosterone for 48 h. In (b), white circles, control; black squares, corticosterone; black triangles, corticosterone + RU486. The levels of H6pd, 11 β-Hsd1, G6Pase and Pepck mRNA expression (c, d) in cells treated with corticosterone (1×10⁻⁶mol/l) or insulin (1×10⁻⁶mol/l) in the presence or absence of RU486 (1×10⁻⁶mol/l) for 48 h. In (d), white bars, 11 β-Hsd1; black bars, G6Pase; grey bars, Pepck. Production and relative quantification of H6PDH protein levels are expressed relative to the amount of GAPDH. Relative H6PDH activity was measured on the basis of NADPH production at 5 min intervals for 20 min. Values are the mean± SEM from three separate culture preparations. *p<0.05, **p<0.01, ***p<0.001 vs controls; ††p<0.01, †††p<0.001 vs corticosterone-treated hepatocytes. C, control; B, corticosterone; I, insulin; RU, RU486

