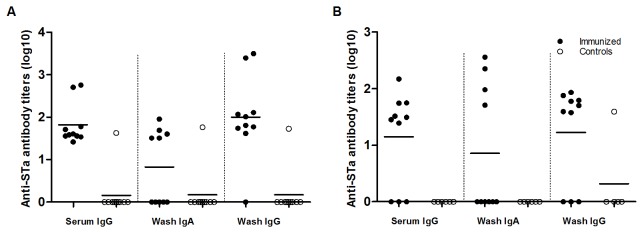
Figure 3. Anti-STa IgG and IgA antibody titration of serum and intestinal wash samples of IP or IN immunized mice (solid dots) and the control mice (circles).

Panel A: anti-STa IgG and IgA antibodies titers in the serum and intestine wash samples of the IP immunized mice, but not in the control mice (p<0.01). Panel B: anti-STa IgG and IgA antibodies titers from serum and intestine wash samples of the IN immunized mice, and no anti-STa IgG or IgA antibodies detected in the control mice (p<0.01). For STa antibody titration ELISAs, 1.3 - 2 ng STa-ovalbumin conjugates were used to coat each well of a Costar plate (Nunc); HRP-conjugated goat-anti-mouse IgG (1:3000) or IgA (1:1000) as the secondary antibodies. Optical densities of greater than 0.4 (after subtracting the background reading) were used to calculate anti-STa antibody titers (in log10).
