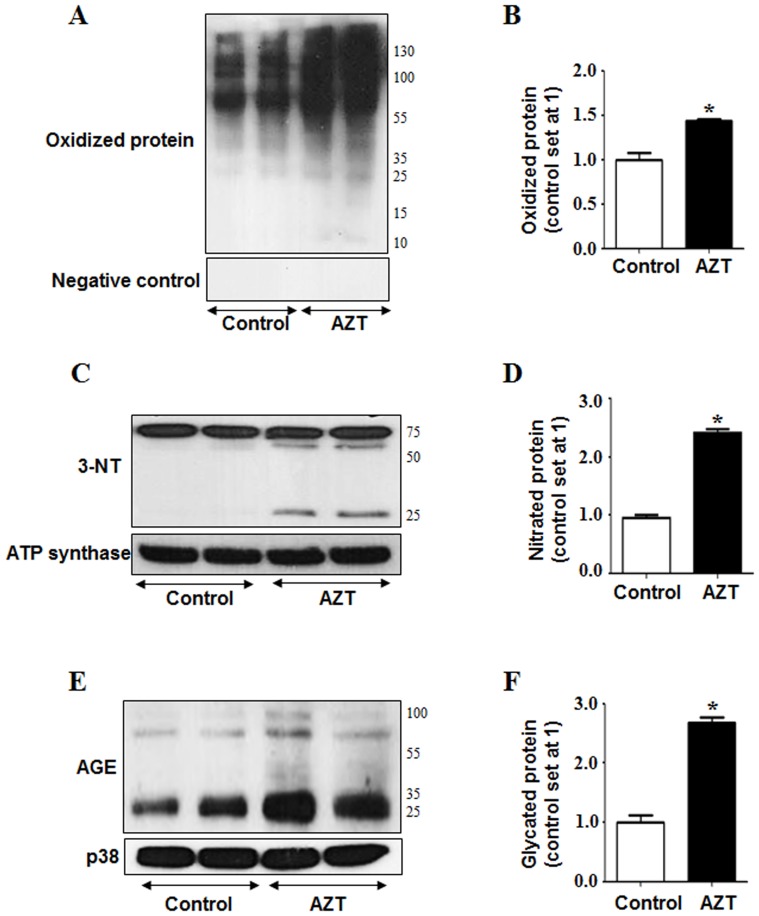
Figure 4. AZT-mediated protein modifications.
(A) Equal amounts of mitochondrial proteins (50 µg/lane) from the different groups were used to evaluate protein oxidation (upper panel) using Oxyblot analysis or negative control (lower panel). (B) Densities of mitochondrial oxidized proteins were normalized with that of the controls set at 1. (C) Equal amounts of mitochondrial proteins were used to evaluate protein nitration as reflected by 3-NT bands (upper panel) and ATP synthase loading control (lower panel) from different groups. (D) The densities of mitochondrial 3-NT bands were normalized to that of ATP synthase and plotted as the value of controls being 1. (E) Total liver homogenates (50 µg/lane) were used to evaluate the levels of AGE (upper panel) and p38 (lower panel) as a loading control. (F) The densities of AGE bands were normalized to that of p38 and plotted as the value of controls being 1. *Significantly different from the control group. Data indicate mean±SE, p<0.05. All experiments have been conducted three times.

