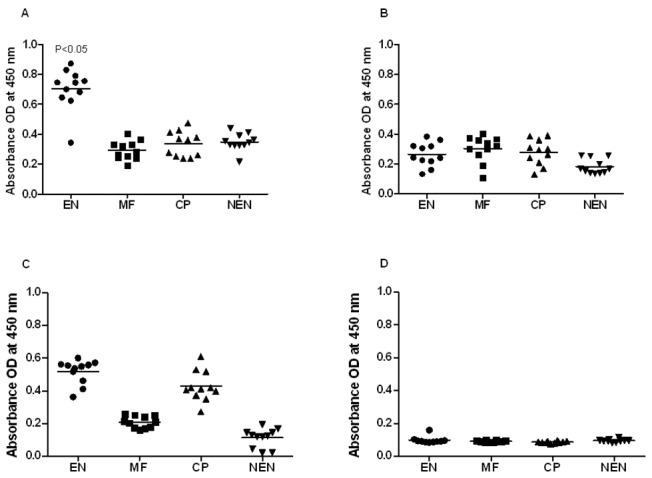
Figure 3. TSP LEL specific IgG isotype of antibodies in the sera of human.

Isotype of IgG antibodies A) IgG1, B) IgG2, C) IgG3 and D) IgG4 against rWbTSP LEL were measured in the sera of putatively immune individuals (n=10) using an indirect ELISA. Each data point represents sera sample from a single individual. Horizontal lines represent geometric mean value. Data is represented as scatter plot where each dot represents absorbance of individual sera. Significant *(P<0.05) levels of isotype antibodies in EN individuals compared to other groups (One way ANOVA along with Tukey-Kramer post statistics test was used).
