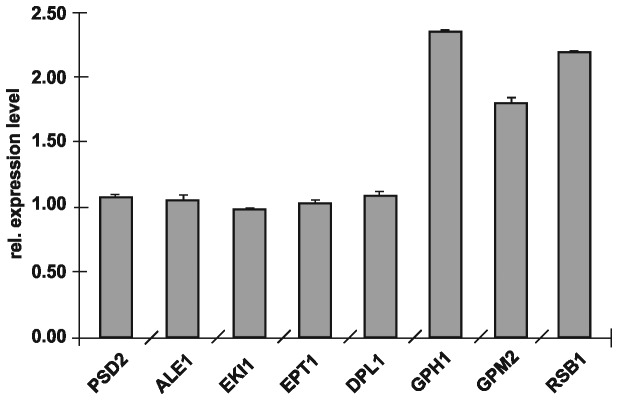
Figure 1. Gene expression analysis.

Relative gene expression of PSD2, ALE1, EKI1, EPT1, DPL1, GPH1, GPM2 and RSB1 was measured by qRT-PCR from isolated RNA of wild type and Δpsd1. Expression of the respective genes in wild type was set at 1 and values obtained with RNA isolated from Δpsd1 were set in relation. Data are mean values from three independent experiments with the respective deviation.
