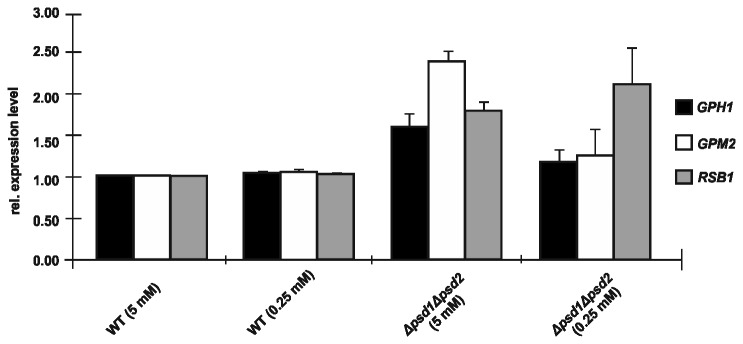
Figure 3. Gene expression of GPH1, GPM2 and RSB1 in Δpsd1Δpsd2 with variable supplementation of ethanolamine.

Relative gene expression of GPH1, GPM2 and RSB1 was measured by qRT-PCR from isolated RNA of wild type and Δpsd1Δpsd2 cultivated in the presence of different amounts of ethanolamine (values in brackets). Expression of the respective genes in wild type supplemented to a final concentration of 5 mM was set at 1, and values obtained with RNA isolated from Δpsd1Δpsd2 supplemented with 5 mM or 0.25 mM ethanolamine, respectively, were set in relation. Data are mean values from three independent experiments with the respective deviation.
