
Figure 4. Subcellular localization of Gpm2p-GFP and Rsb1p-GFP by fluorescence microscopy.
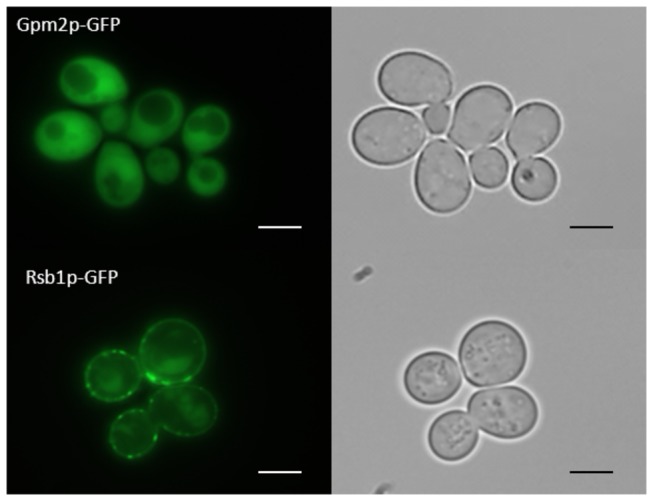
Fluorescence microscopy was carried out as described in the Methods section. Cells were grown in minimal medium –ura –met at 30°C to the late exponential phase and GFP fluorescence (left panel) was detected as described. Corresponding transmission microscopy of cells is shown in the right panel Subcellular distribution of Gpm2p-GFP (upper lane) and Rsb1p-GFP (lower lane) is shown. The size of the scale bar is 1 µm.