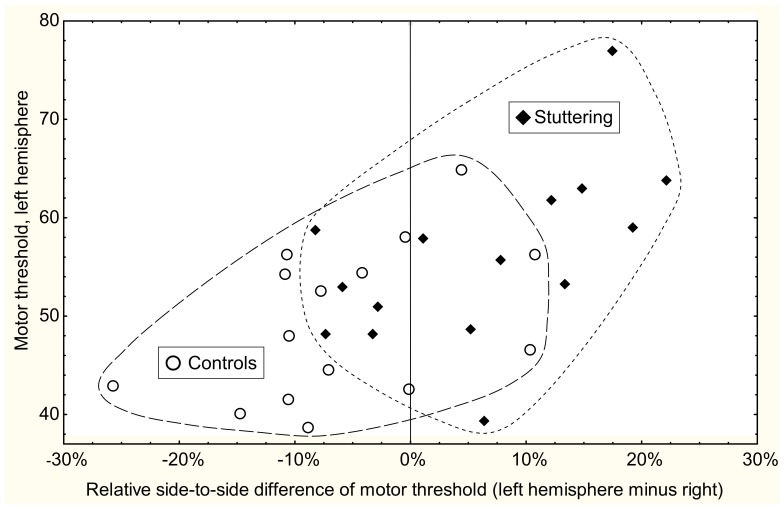
Figure 1. Side-to-side difference of motor threshold in relation to left hemisphere motor threshold.
Scatter plot of individual motor threshold (MT) results: relative side-to-side difference of MT (left minus right, in percent of mean MT) versus MT for the left hemisphere. ♦ = stuttering, ○ = controls. The ranges for the groups are marked with dashed lines. The control group showed a tendency towards lower motor threshold for the left hemisphere, here indicated as negative values on the x-axis. The stuttering group showed an opposite tendency.

