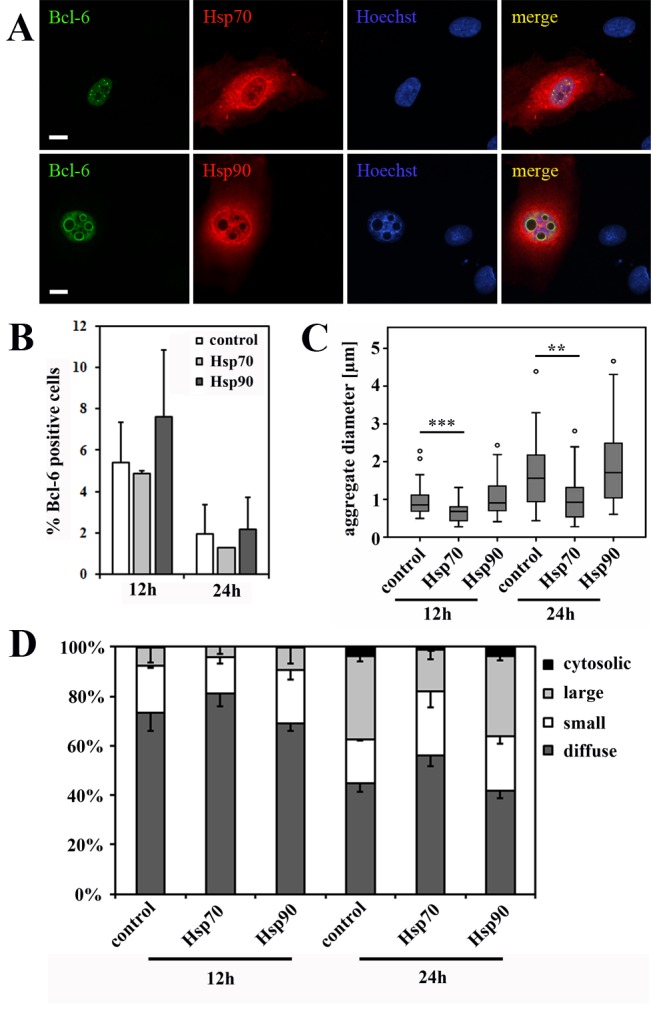
Figure 6. BCL-6 aggregate formation upon co-expression of exogenous HSP70 and HSP90.

ECs were transfected with EFp-BCL‑6 in combination with HSP70-1A or HSP90-HA expression plasmid or with EFp-Link control vector. After 12 and 24 hours cells were stained for CLSM imaging with antibodies against BCL-6 and HSP70 or with antibodies against BCL-6 and HA-tag for HSP90 detection. Hoechst 33342 was applied to counterstain nuclear DNA. (A) CLSM images demonstrate the concomitant overexpression of BCL-6 with HSP70 or HSP90 at 24 hours after transfection (scale bars: 10 µM). (B) The percentage of BCL-6 positive cells was determined from four randomly acquired tile scans (40x objective) covering approximately 700 cells. Mean values and standard deviations from two independent experiments are given; T-test revealed no statistically significant differences. (C) 35 randomly selected nuclei with BCL-6 aggregations were analyzed (per condition) for the diameter of their aggregates. The boxplot illustrates the distribution of acquired values with a statistically significant reduction in aggregate diameter upon co-expression of HSP70 after 12 h (T-test; p < 0.001) and 24 h (T-test; p = 0.001). (D) 300 BCL-6 positive cells (per condition) were classified according to their nuclear BCL-6 expression pattern into diffuse (no aggregation), small punctate, large spherical and additional cytosolic aggregates. Mean values and standard deviations were calculated from 2 independent experiments. The frequency of large, spherical aggregates was significantly reduced upon co-expression of BCL-6 and HSP70 after 24 h (T-test; p = 0.031). *, p < 0.05; **, p < 0.01; ***, p < 0.001.
