
Figure 11. Comparison of plasmid DNA, mRNA and protein content of BCL‑6/BCoR transfected ECs.
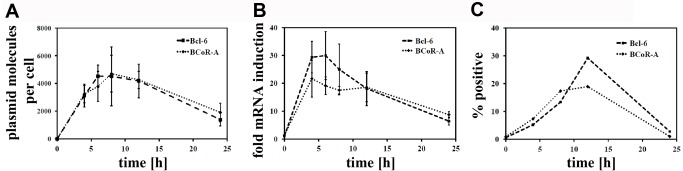
Cells were transfected with EFp-BCL-6 or EFp-BCoR-A expression plasmid. (A) The amount of plasmid per cell was determined by qPCR of cell extracts. The results represent mean values and standard deviations of 3 independent experiments. (B) The increase in mRNA in relation to endogenous levels was measured by qRT-PCR of the corresponding RNA extracts. (C) Protein expression was evaluated by flow cytometry of permeabilized cells and is given as the percentage of BCL-6/BCoR positive ECs.