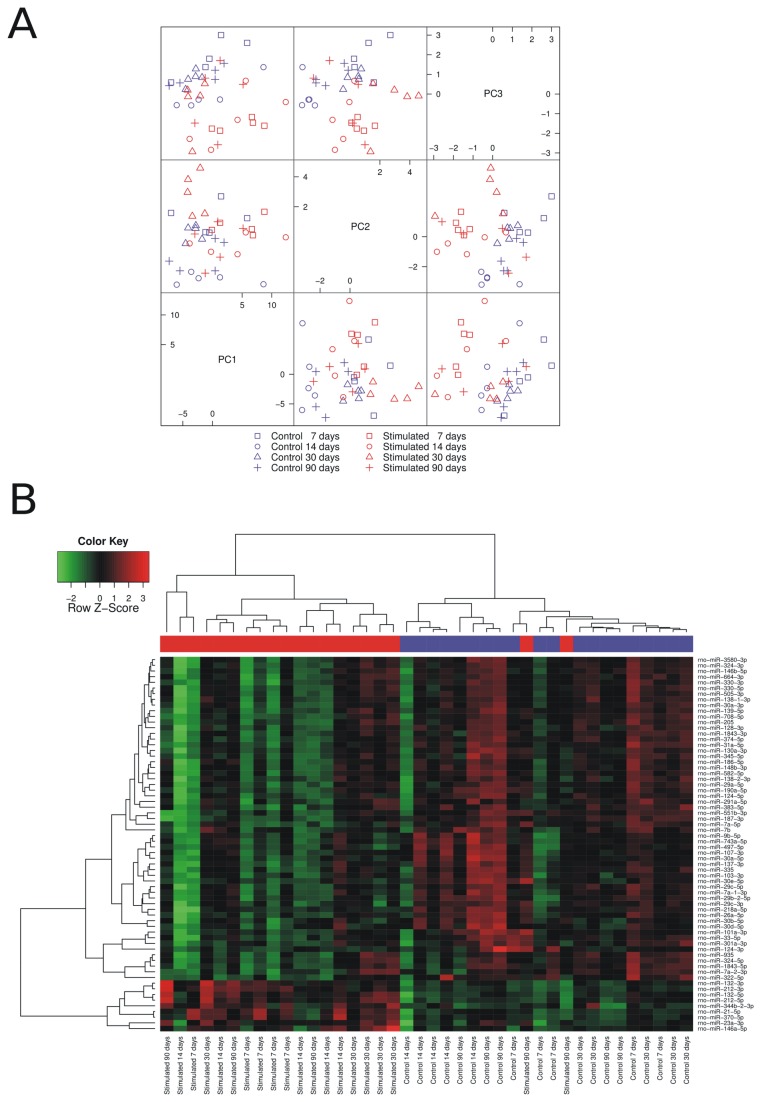
Figure 1. miRNA expression profiles in the dentate gyrus of epileptic and sham-operated control animals at different times after SE.
(A) Principle Component Analysis (PCA) of microarray data derived from epileptic (red) and sham-operated control animals (blue) at 7 d (square), 14 d (circle), 30 d (triangle), and 90 d (cross) after status epilepticus. Each mark represents an individual animal. Note that epileptic animals are separate from the controls. (B) A heatmap of the 66 miRNAs with altered expression levels in epileptic animals (Table 1). Each column represents an individual animal and each row represents an individual miRNA. Colors on the heatmap represent the Z-score: higher – red, lower – green. Red color in the bar over the heatmap panel represents epileptic animals, and blue represents sham-operated control animals.

