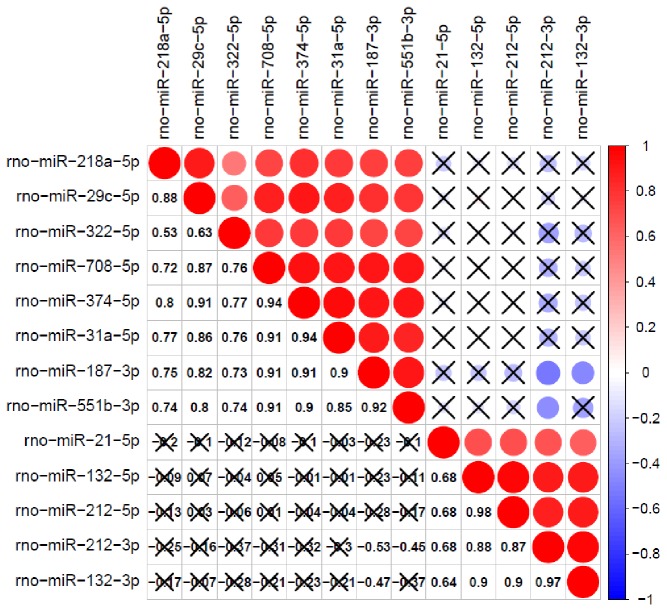
Figure 4. Correlation matrix of expression levels between miRNAs with expression that differs significantly between sham and stimulated animals.
(Table 1.) The color and size of the circles in the matrix code for level of correlation; red represents positive correlation and blue represents negative correlation. Numerical values of correlations are presented in the lower left part of the matrix. Values that do not reach statistical significance are crossed.

