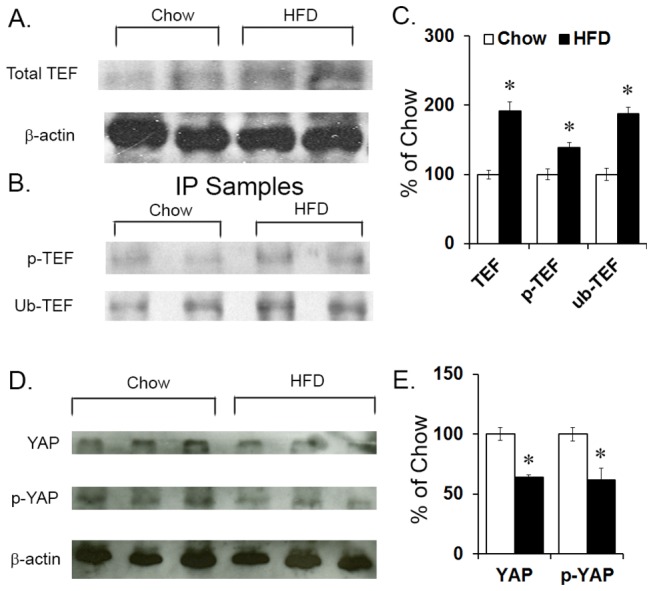
Figure 2. Protein levels in P15 offspring.

(A, C) TEF protein level was measured via western blot in the PVN of high-fat diet (HFD) compared to chow P15 offspring, and a statistically significant increase in total TEF was found. (B, C) Further immunoprecipitation (IP) of total TEF protein from the PVN revealed a statistically significant increase in levels of phosphorylated TEF and ubiquitin-tagged TEF. (D, E) YAP protein level was measured via western blot in the PVN of high-fat diet (HFD) compared to chow P15 offspring, and a statistically significant decrease in total YAP and phosphorylated YAP protein was found. Results are expressed as means ± SEM (n = 4) *p < 0.05. The β-actin bands were used to ensure that all samples had the same concentration of protein; they were not used to normalize TEF and YAP bands. The change in TEF and YAP band densities from the HFD group was determined relative to the chow control group. p-TEF = phosphorylated TEF; ub-TEF = ubiquitin-tagged TEF.
