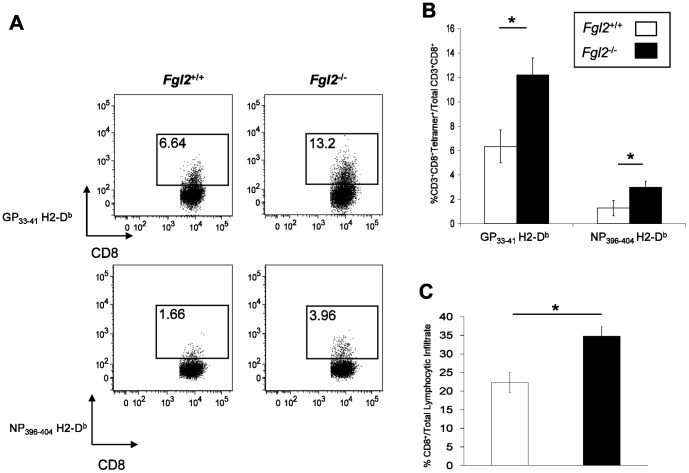
Figure 4. Targeted deletion of fgl2 results in augmented anti-viral T cell responses in the liver.
A-B) Liver mononuclear cells were isolated from fgl2+/+ or fgl2 −/− mice on day 8 post-infection and stained with the MHC tetramers GP33–41 H2-Db or NP396–404 H2-Db. Flow plots are representative of at least 4 different mice per group and are representative of 2 independent experiments. Graph shows the mean±SEM of 4 mice per group. C) Livers from fgl2+/+ and fgl2 −/− infected mice were analyzed for the presence of CD8+ T cells by immunohistochemistry and quantification of positive cells was performed using the Aperio ScanScope XT (Aperio Technologies, Vista, CA, USA). Digital images were recorded within a specified Aperio Spectrum database and analyzed using the commercially available Aperio image analysis software. Data represent the mean±SEM of 5 mice per group at each time point. Comparison between groups were performed using a one-way ANOVA for statistical analysis;* P<0.05.

