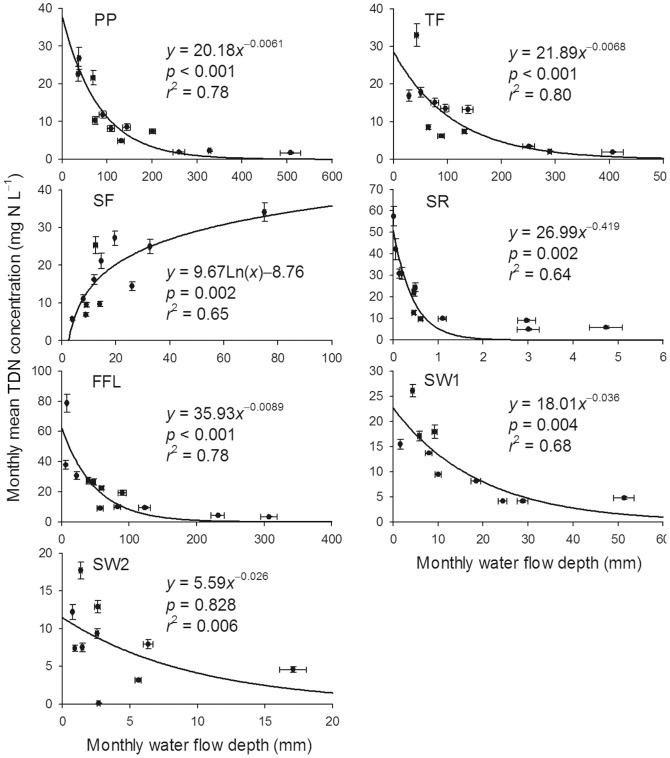
Figure 3. Relationships between monthly water flow depths and monthly mean total dissolved nitrogen concentrations.
Abbreviations: TDN = total dissolved nitrogen, PP = precipitation, TF = throughfall, SF = stemflow, SR = surface runoff, FFL = forest floor leachate, SW1 = soil water at 40 cm belowground, SW2 = soil water at 100 cm belowground. Bars indicate ± SD, n = 3.

