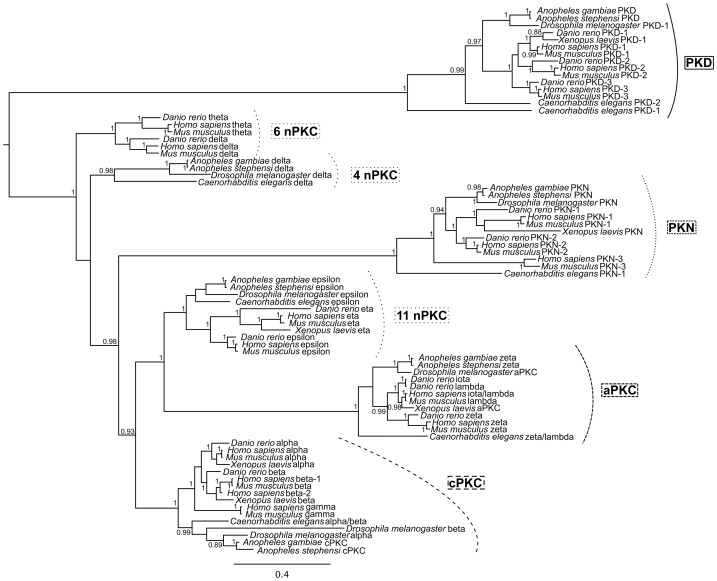
Figure 2. Midpoint-rooted Bayesian tree based on analysis of the GBFILT dataset.
Node support values represent Bayesian posterior probabilities (values below 0.85 are not shown). Groupings of specific PKC gene family members are marked. Accession numbers of all sequences used for this analysis are listed in Table S1.

