
Figure 3. Expression of the PKC gene family in Anopheles stephensi midgut epithelium.
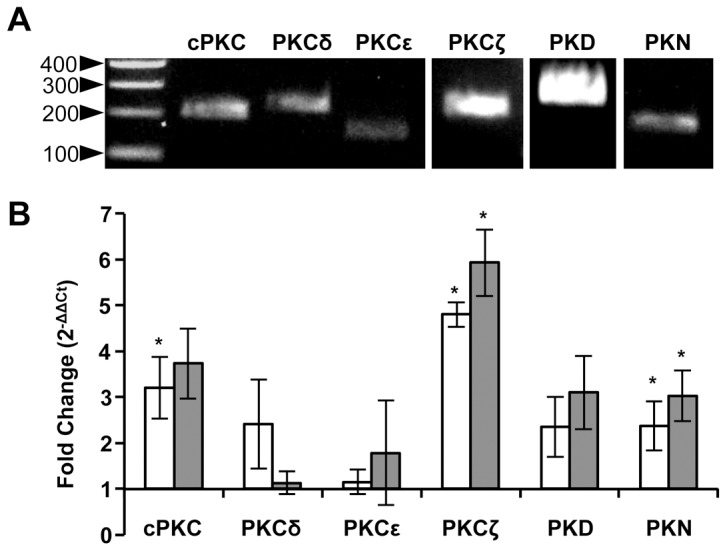
Total RNA was isolated and converted to cDNA from 30 dissected A. stephensi midguts at 24 h post-blood feeding. (A) PKC-specific primers were used to amplify cDNA by conventional PCR, ladder (bp) is shown on left. (B) Fold change in the expression of PKC genes in blood fed (white bars) or FTPP fed (gray bars) mosquitoes compared to non-blood fed control mosquitoes as determined by qRT-PCR. Means ± SEMs from 2–3 independent experiments with separate cohorts of mosquitoes. Pairwise comparisons of treatments and matched controls (non-blood fed A. stephensi) were analyzed by Student’s t-test, *p<0.05.