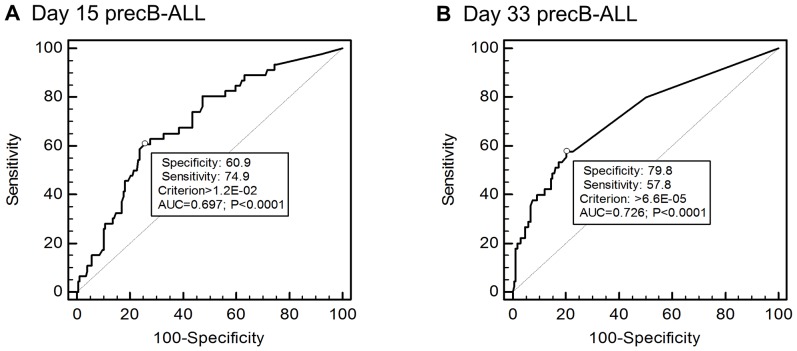
Figure 3. Assessment of optimal thresholds for MRD prediction of relapse.
Receiver Operating Characteristic (ROC) curves show the relationship between true-positive (Sensitivity) and false-positive (100-Specificity) rates at different thresholds with the optimal MRD threshold marked with a ° symbol on the curve. AUC = Area under the curve and the P value is the probability that AUC = 0.5 (shown by the dotted line) which represents a test with no predictive value. ROC curves are shown for (A) Day 15 MRD to predict relapse in 223 precursor B-ALL ANZCHOG ALL8 patient and (B) Day 33 MRD in 219 of the 223 patients (4 patients lack sufficient DNA for analysis). ROC curves for T-ALL patients at both timepoints did not reach significance.

