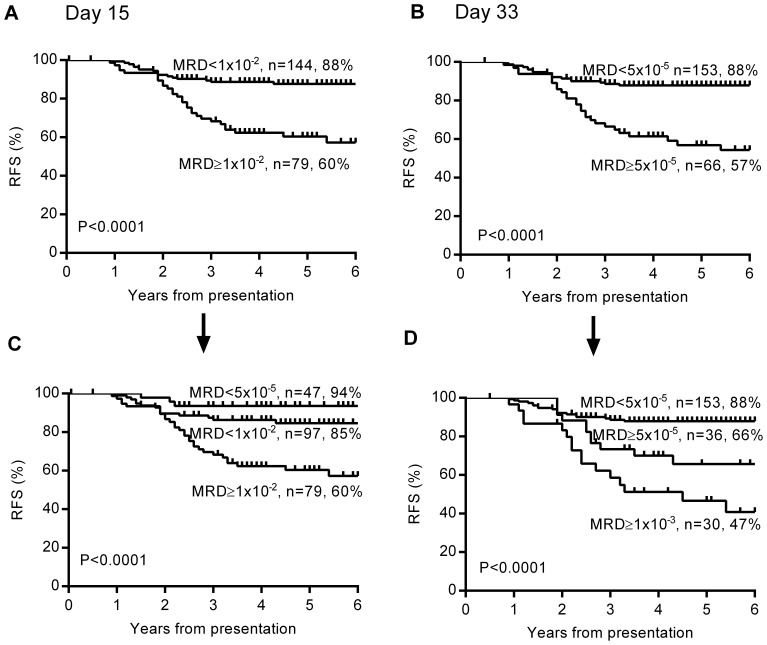
Figure 4. Prognostic value of MRD at day 15 and day 33 in precursor B-ALL.
Kaplan Meier survival curves based on the MRD thresholds determined by ROC analysis are shown for A) 223 precursor B-ALL patients split according to Day 15 MRD B) the same patients based on Day 33 MRD. A second MRD threshold is added to identify 3 risk levels for both C) Day 15 MRD and D) Day 33 MRD. The number of patients and 5 year relapse-free survival percentage are given for each subgroup.

