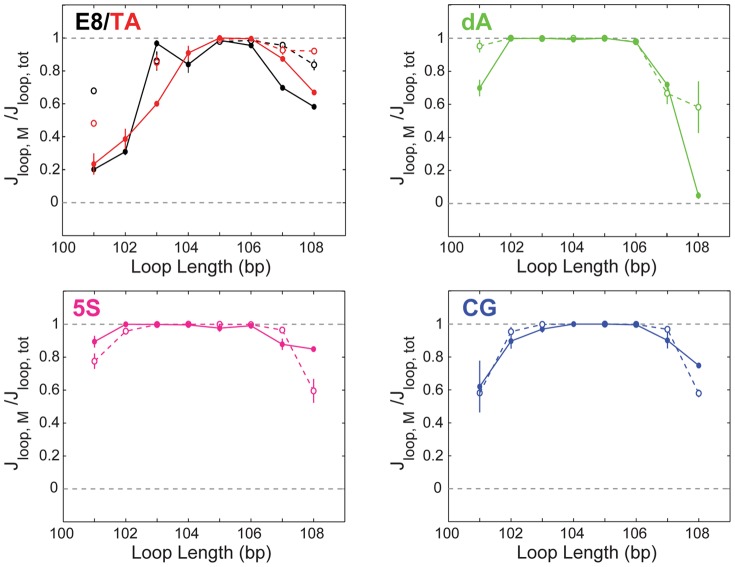
Figure 3. Comparison of the likelihood of the “middle” (longer) versus “bottom” (shorter) looped states.
The y-axes indicate the fraction of the total J-factor that is contributed by the middle state (as in Fig. 2, since the with- and without-promoter constructs have different operators, J-factors and not looping probabilities must be compared). That is, when the ratio  is unity, indicated by a horizontal black dashed line, only the middle state is observed; when this ratio is zero, again indicated by a horizontal black dashed line, only the bottom state is observed. Closed circles are no-promoter constructs; open circles are with-promoter. E8 and TA data are a subset of those in [35]. Figure S4 in File S1 shows the looping probabilities and J-factors for the two states instead of the relative measures shown here.

