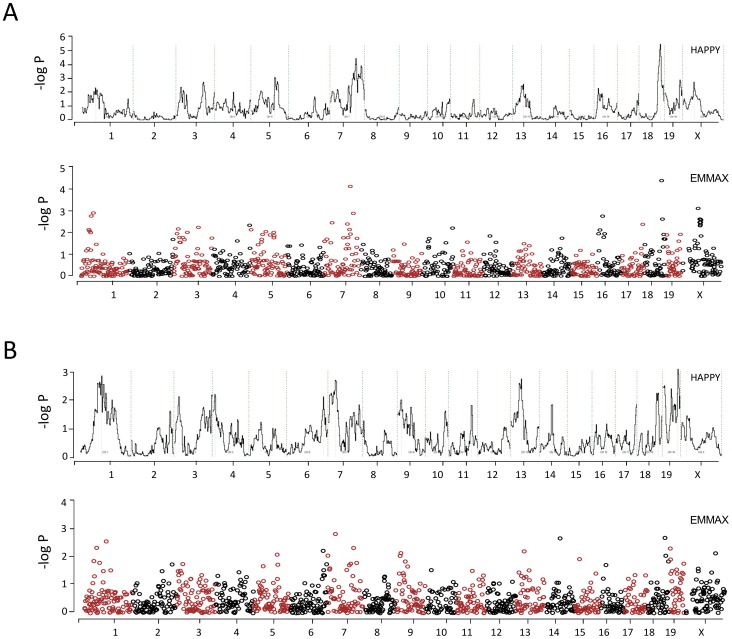
Figure 1. Whole-genome association map for spontaneous arthritis traits.
Phenotypes are (A) susceptibility to disease, and (B) disease severity, measured as maximum score. Each graph represents the strength of association between phenotype and marker, using HAPPY (linear plot) or EMMAX (Manhattan plot), for the whole set of 366 G4 mice tested. Gender and ColVII immunization were used as covariates. The x-axis indicates the SNP's chromosomal position, and the y-axis shows the -log P value of association.

