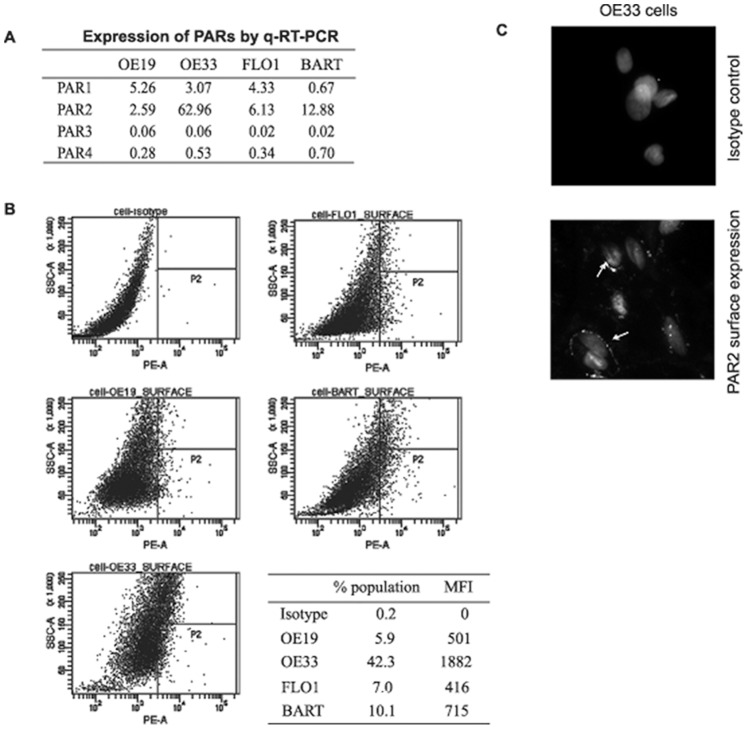
Figure 1. Cell immnunofluorescent staining for determination of PAR-2 surface expression.
(A) RNA expression profiling of PAR members by q-RT-PCR. (B) Contour plot of SSC vs. anti-PAR-2 antibody PE fluorescence. All cells subjected to analysis were first plotted by FSC (forward light scatter) vs. SSC (side light scatter) and gated to exclude debris and clumps. P2 is set for gating positive cells based on isotype control. Affiliated table shows percentage of positive cells (% of population) and MFI (mean fluorescent intensity, value subtracted from isotype background). (C) Representative image of immunofluorescence staining of PAR-2 on OE33 cell surface. Top picture shows the isotype control staining. Arrows in bottom picture indicate cell membrane staining for PAR-2 with anti-PAR-2 antibody N-19. Cell nuclei were stained with DAPI. Offset and gain values of the photomultiplier channel were regulated with respect to the setup selected for isotype negative control to make fluorescence intensity comparable across all samples.

