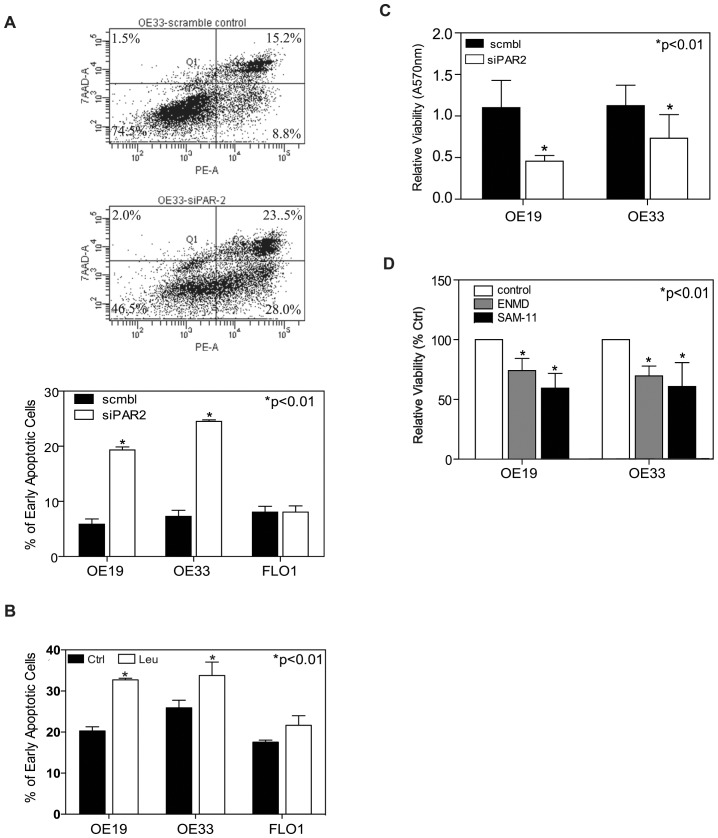
Figure 5. Effects of depletion and inactivation of PAR-2 on cell apoptosis.
(A) Representative counter plot of Annexin V v.s. 7-ADD staining for apoptotic cells measured by flow cytometric analysis upon siRNA PAR-2 knockdown in OE33 cells; (B) Apoptosis is expressed as a percentage of early apoptotic cells (right lower quadrant) in total cell population for OE19, OE33 and FLO1. (C) Effect of siRNA PAR-2 knockdown on cell viability measured by MTT assay in OE19 and OE33 cells. (D) PAR-2 inactivation with its antagonist ENMD or anti-PAR-2 antibody SAM -11 decreased cell viability in comparing with untreated control cells in OE19 and OE33 cell.

