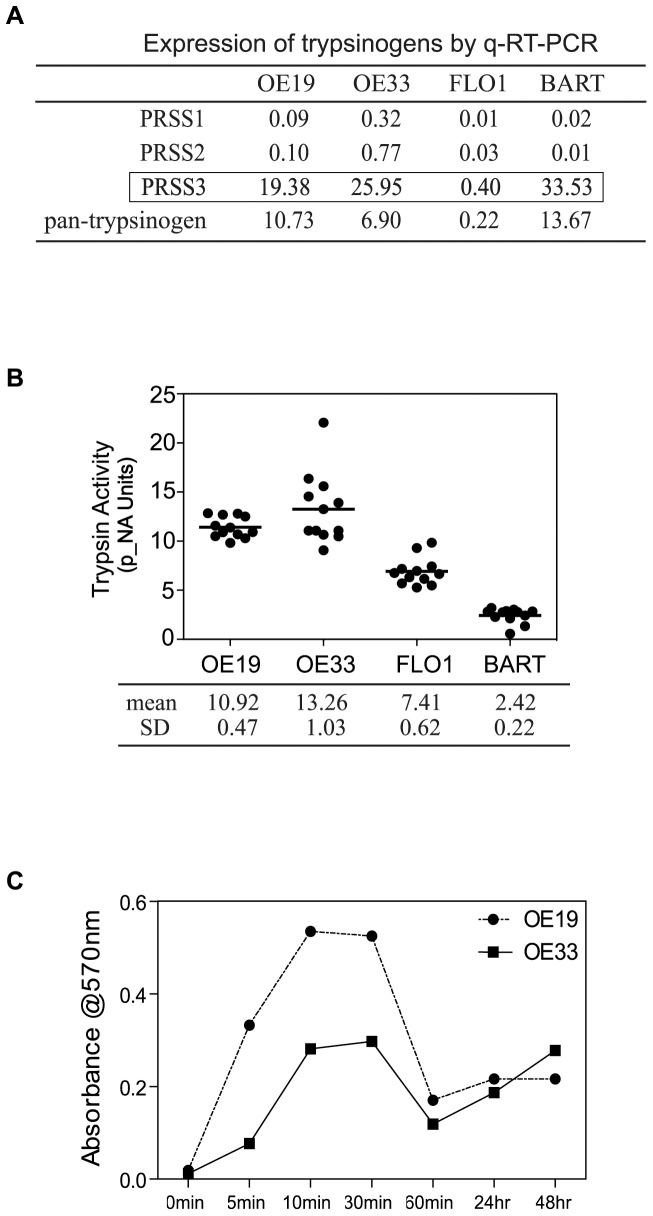
Figure 6. Profiling expression of trypsinogens and autocrine trypsin activity.
(A) Quantitative RT-PCR analysis of RNA expression of trypsinogens in EA cells and BART cells. Table shows the preferential transcriptional expression of type 3 trypsinogen (PRSS3). (B) Trypsin enzymatic activities in cultured media were determined by BioVision Trypsin Activity Assay Kit. Trypsin activities were calculated and converted into p-NA units and are presented as mean±SD (n = 12), three experiments of quadruplicates tested. (C) Trypsin activities in cultured media from OE19 and OE33 were detected by BioVision Trypsin Activity Assay Kit over up to 48 hrs time courses, curves indicating the kinetic secretion of trypsin of both cells.

