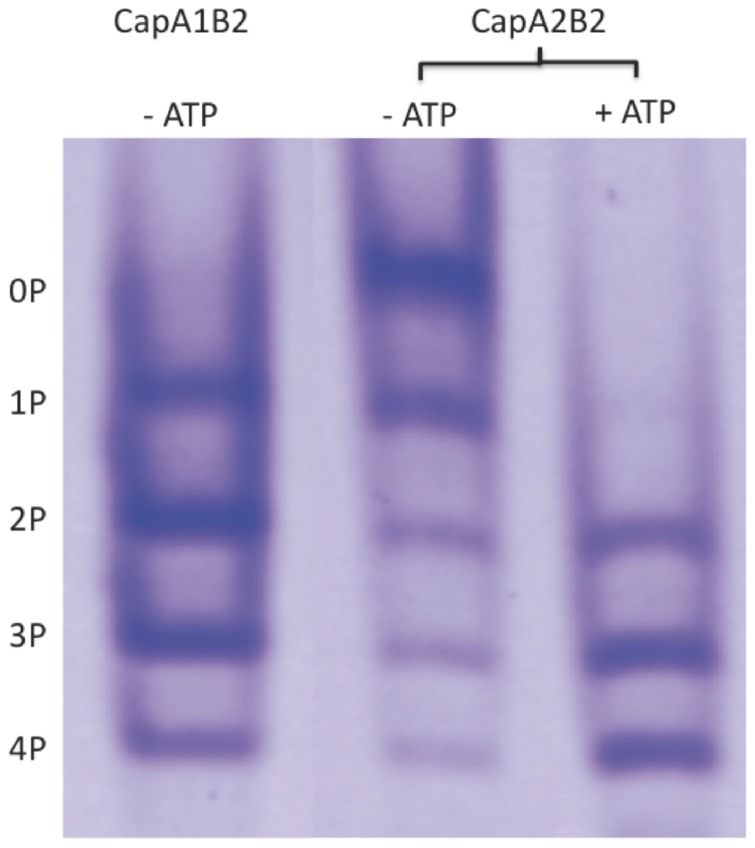
Figure 3. CapA2B2 phosphorylation state analysis.
Electrophoretic profile of CapA1B2 and CapA2B2 directly after purification (− ATP) or after 4h incubation at 37°C with 200 µM ATP-Mg (+ATP). The proteins were loaded on a 12.5% non-denaturing polyacrylamide gel and stained with Coomassie Brilliant Blue. The five observed bands were labeled according to the mass spectrometry analysis previously performed on CapA1B2 [16]: the upper band corresponds to the non-phosphorylated form of the protein (0P), and the lower band to the fully phosphorylated form (4P).

