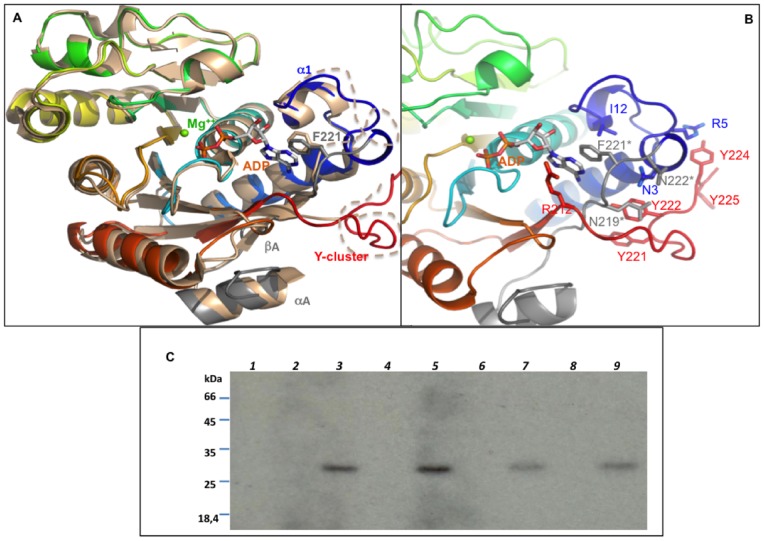
Figure 4. Comparison CapA1B2/CapA2B2. A.
– Superimposition of the CapA2B2 structure on a monomer from the CapA1B2(K55M)/ADP-Mg octamer (PDB ID 2VED). The proteins are shown as cartoon. CapA1B2(K55M) is colored by spectrum from blue to red. The CapA1 region is highlighted in grey and labeled (αA, βA). The CapA2B2 structure is colored in wheat. The disordered Y-cluster and loop βA-α1 are highlighted as dashed lines. Residues F221* from CapA1 and F220 from CapA2 are shown in sticks as well as the ADP molecule bound in the CapA1B2(K55M) structure. B – Interaction networks of the CapA1 C-terminus and of the CapB2 N-terminus. Close view of the CapA1B2(K55M) structure shown in cartoon colored by spectrum. The bound ADP is shown in sticks with the Mg2+ ion as a green sphere. Residues discussed in the text are highlighted in sticks. CapA1 residues are labeled with a star. C – Effect of CapA1 residue Asn222 on CapB2 activity. CapB2 was incubated in the presence of radioactive ATP and different (wild type or mutated) CapA1 or CapA2 cytoplasmic C-terminal end peptides (CapA1Ct and CapA2Ct). CapB2 autophosphorylation was then analyzed by SDS-PAGE and autoradiography. (lane 1) CapB2; (lane 2) CapA1Ct; (lane 3) CapB2 and CapA1Ct; (lane 4) CapA1Ct deleted from Asn222 (CapA1CtΔN222); (lane 5) CapB2 and CapA1CtΔN222; (lane 6) CapA2Ct; (lane 7) CapB2 and CapA2Ct; (lane 8) CapA2Ct with a C-terminal additional Asn221 (CapA2Ct+N221); (lane 9) CapB2 and CapA2Ct+N221.

