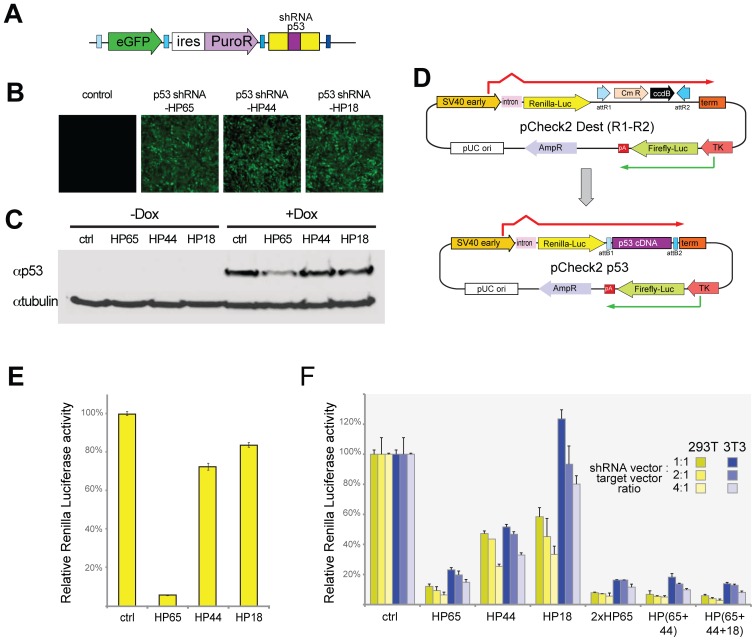
Figure 4. Rapid screening of p53 knockdown using stable and transient pLEG shRNAmir expression.
A) A schematic depicting the general structure of the pLEG lentiviral expression vector after recombination with an shRNAmir cassette targeting p53. B) Stable cell populations were generated by infecting NIH 3T3 cells with lentivirus and selected for puromycin resistance. Each stable population expresses a unique miRNA cassette to p53 (HP65; HP44; HP18). Levels of expression are indicated by eGFP. C) A Western showing lysates from the stable cell lines (B) as well as the untransfected cells with and without doxorubicin induction. D) An overview of the pCheck2 system for rapidly triaging novel miRNAs before and after recombination to insert p53 cDNA downstream of Renilla luciferase. The recombination reaction is performed between attL1–attL2 and attR1–attR2 sites allowing for compatibility with all standard cDNA entry plasmids (attL1–attL2). E) Transfections of the pCheck2 p53 dual luciferase reporter plasmid into stable cell populations (from C) expressing the three miRNAs to p53 as well as uninfected control cells. The relative activity of Renilla luciferase is displayed as a percent ratio of firefly to Renilla activity scaled to the control cells (miRNA to dsRed – dsRed01). F) Transfections of the pCheck2 p53 along with pLEG vectors containing control shRNAmir (to dsRed) or to p53 (single and daisy chained cassettes) were performed with three different ratios of miRNA to pCheck2 target (1∶1, 2∶1, 4∶1) in both NIH 3T3 and HEK 293T cell lines. Luciferase activity was measured as in (E) and is displayed as a relative percent scaled to the control transfections. SV40 early: SV40 virus promoter/enhancer; TK: thymidine kinase promoter; pA: poly adenylation signal.

